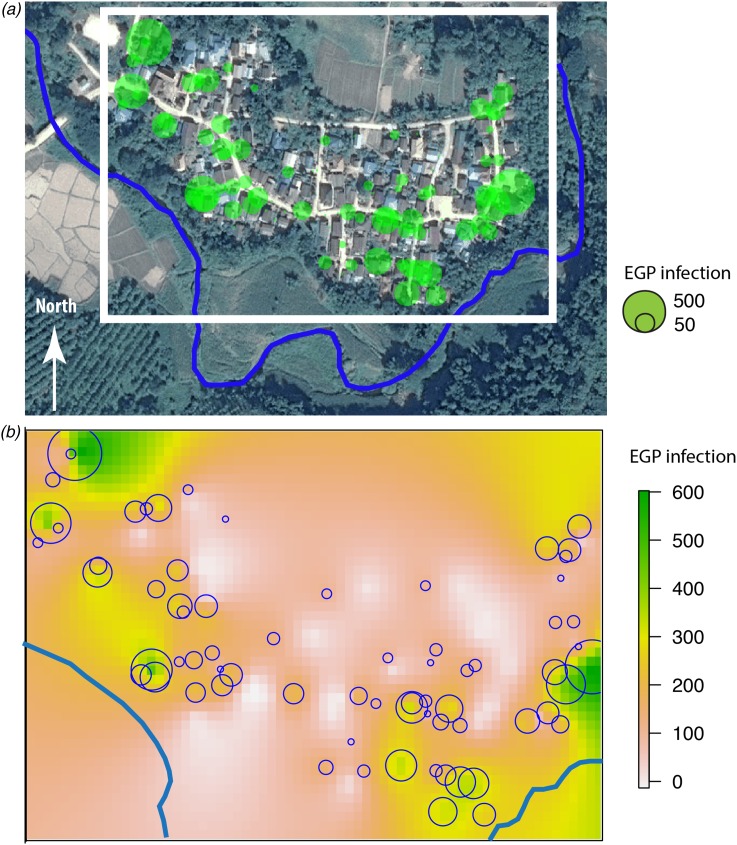
Fig. 3.
(a) Huay Muang map of fish-borne trematodes infection level (EPG) at household level with a size of green circles corresponding to the level of EPG infection for each household (white rectangle corresponds to the kriging area of (b); river in blue); (b) interpolation of fish-borne trematodes infection by kriging in a grid based on geographical coordinates of households with a scale of EPG infection from low infection in yellow to high infection in green.

