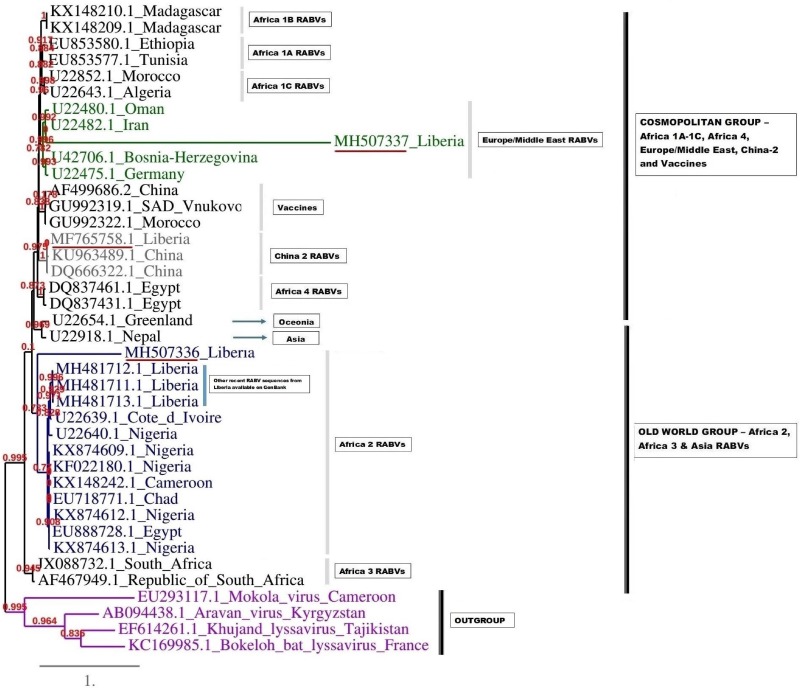
Fig. 5.
Maximum likelihood (ML) phylogenetic tree of the MH507336 and MH507337 generated using ML algorithm. The analysis involved 39 nucleotide sequences. Evolutionary analyses were conducted in PHYML3 [20]. The bootstrap values (%) are shown next to the branches. The tree is drawn to scale, with branch lengths in the same units as those of the evolutionary distances used to infer the phylogenetic tree. The evolutionary distances were computed using the Kimura two-parameter method [18] and are in the units of the number of base substitutions per site.

