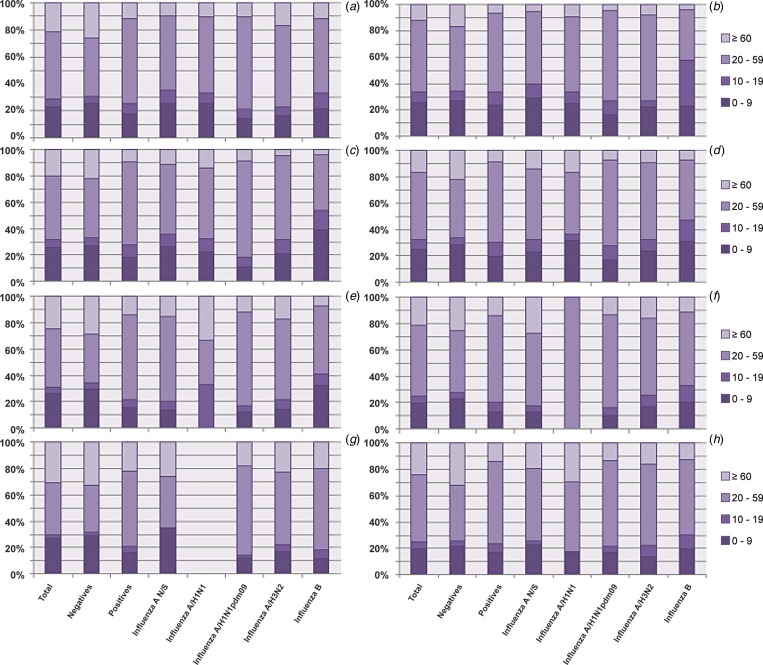
Fig. 3.
Analysis of the proportion of different subtypes in each age group from 2010 to 2016. The figure shows the proportion of influenza cases in general and by subtype in each age group throughout the study period. (a) Total; (b) 2010; (c) 2011; (d) 2012; (e) 2013; (f) 2014; (g) 2015 and (h) 2016.

