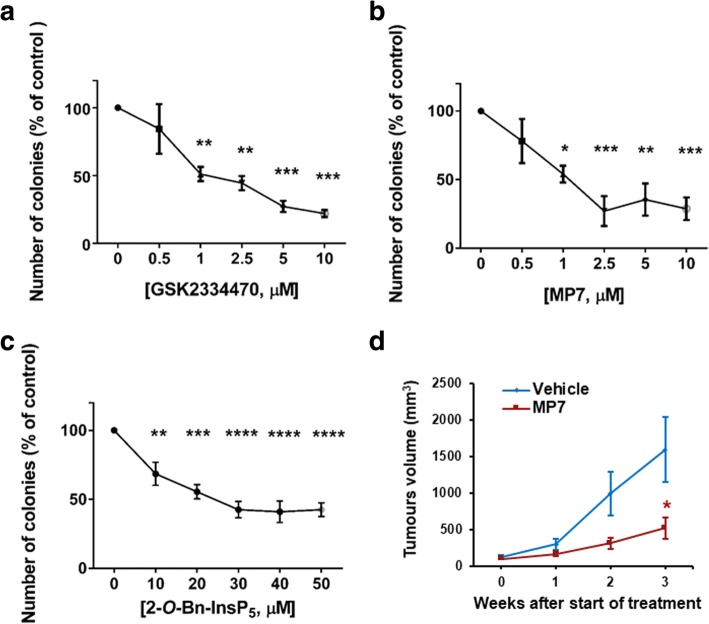
Fig. 3.
Pharmacological inhibition of PDK1 reduces PDAC cells anchorage independent growth and PDAC cells growth in vivo. (a-c) AsPC-1 cells were treated with PDK1 inhibitors and plated on soft agar. After 5 weeks, colonies were stained and counted using ImageJ software. Data are expressed as percentage of control cells treated with DMSO and are means ± SEM of n ≥ 3 independent experiments performed in duplicate. One-way ANOVA with Dunnett’s multiple comparisons test was used for statistical analysis between each treatment and its corresponding DMSO-treated control. Analysis was performed with GraphPad Prism version 6.0. *p < 0.05, **p < 0.01, ***p < 0.001, ****p < 0.0001. (d) Mice (n = 7/group) were injected with HPAF-II cells and treated as described in the Methods section. Data indicate means ± SEM of tumour volumes at the indicated times after start of treatment with MP7. * p < 0.05 as assessed by Student’s t-test

