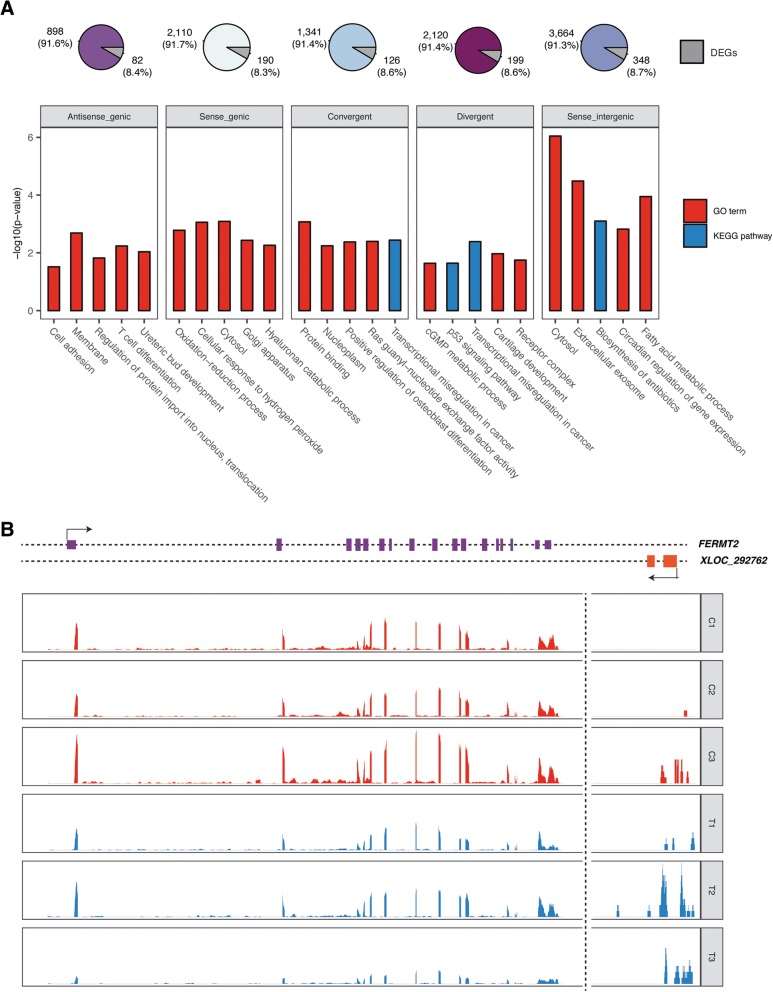
Fig. 4.
Prediction of lncRNA functions. a Enrichment of highly correlated mRNAs of different lncRNA types. LncRNAs were divided into 5 panels based on their type and were designated with a distinct color in the pie chart. Pie charts show the percentage of differentially expressed genes (DEGs) among correlated genes. b Exhibition of possible cis-acting lncRNA XLOC_292762 which locates at 5700 bp downstream. The expression scale of XLOC_292762 is different to FERMT2

