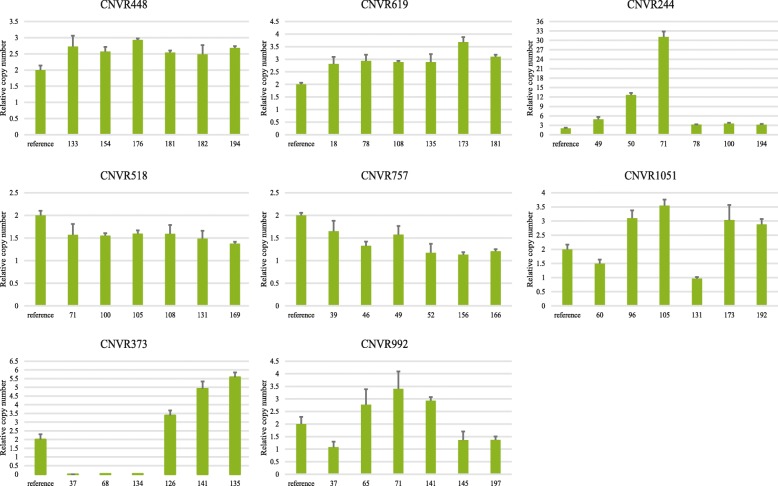
Fig. 3.
qPCR results for 8 validated CNVRs. The y-axis shows the normalized ratios and x-axis shows the references and samples. Samples with normalized ratios of appropriately 0 or 1 represent individuals with instances of copy number loss, while those with values of appropriately 3 or more represent individuals with copy number gains (P < 0.05). Values of 2 represent a normal copy number

