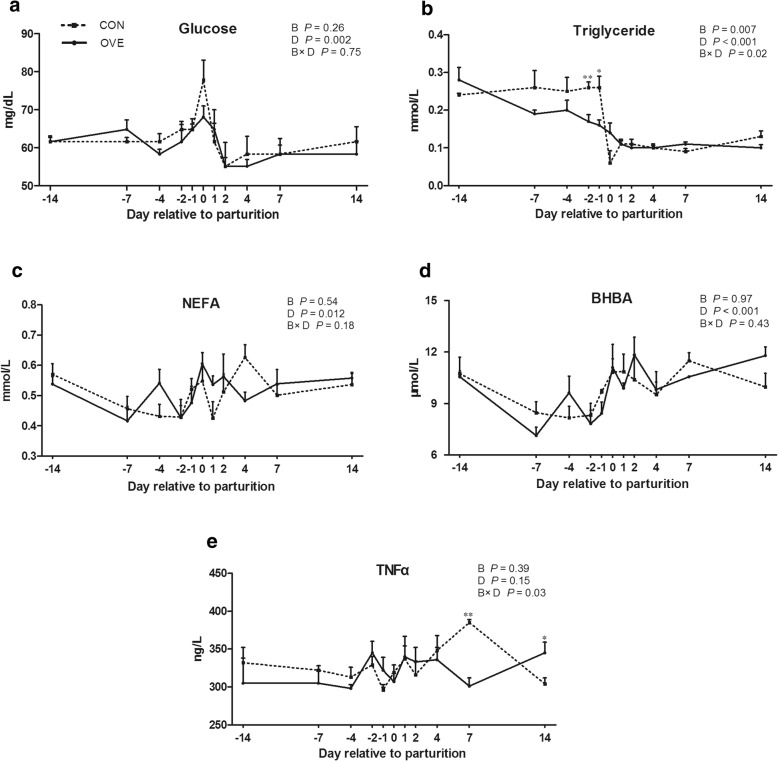
Fig. 1.
Effects of prepartum BCS on serum glucose (a), triglycerides (b), NEFAs (c), BHBA (d), and TNFα (e) in transition dairy cows. Error bars indicate the standard error of the mean. Significant difference between CON (BCS = 3.0–3.5) and OVE (BCS ≥ 4.0) groups on the same sampling day are noted with * (B × D P < 0.05) or ** (B × D P < 0.01); B, BCS; D, day (day relative to parturition); B × D, interaction between BCS and day relative to parturition; CON, control; OVE, overconditioned; NEFA, non-esterified fatty acid; BHBA, beta hydroxybutyric acid; TNF-α, tumor necrosis factor α

