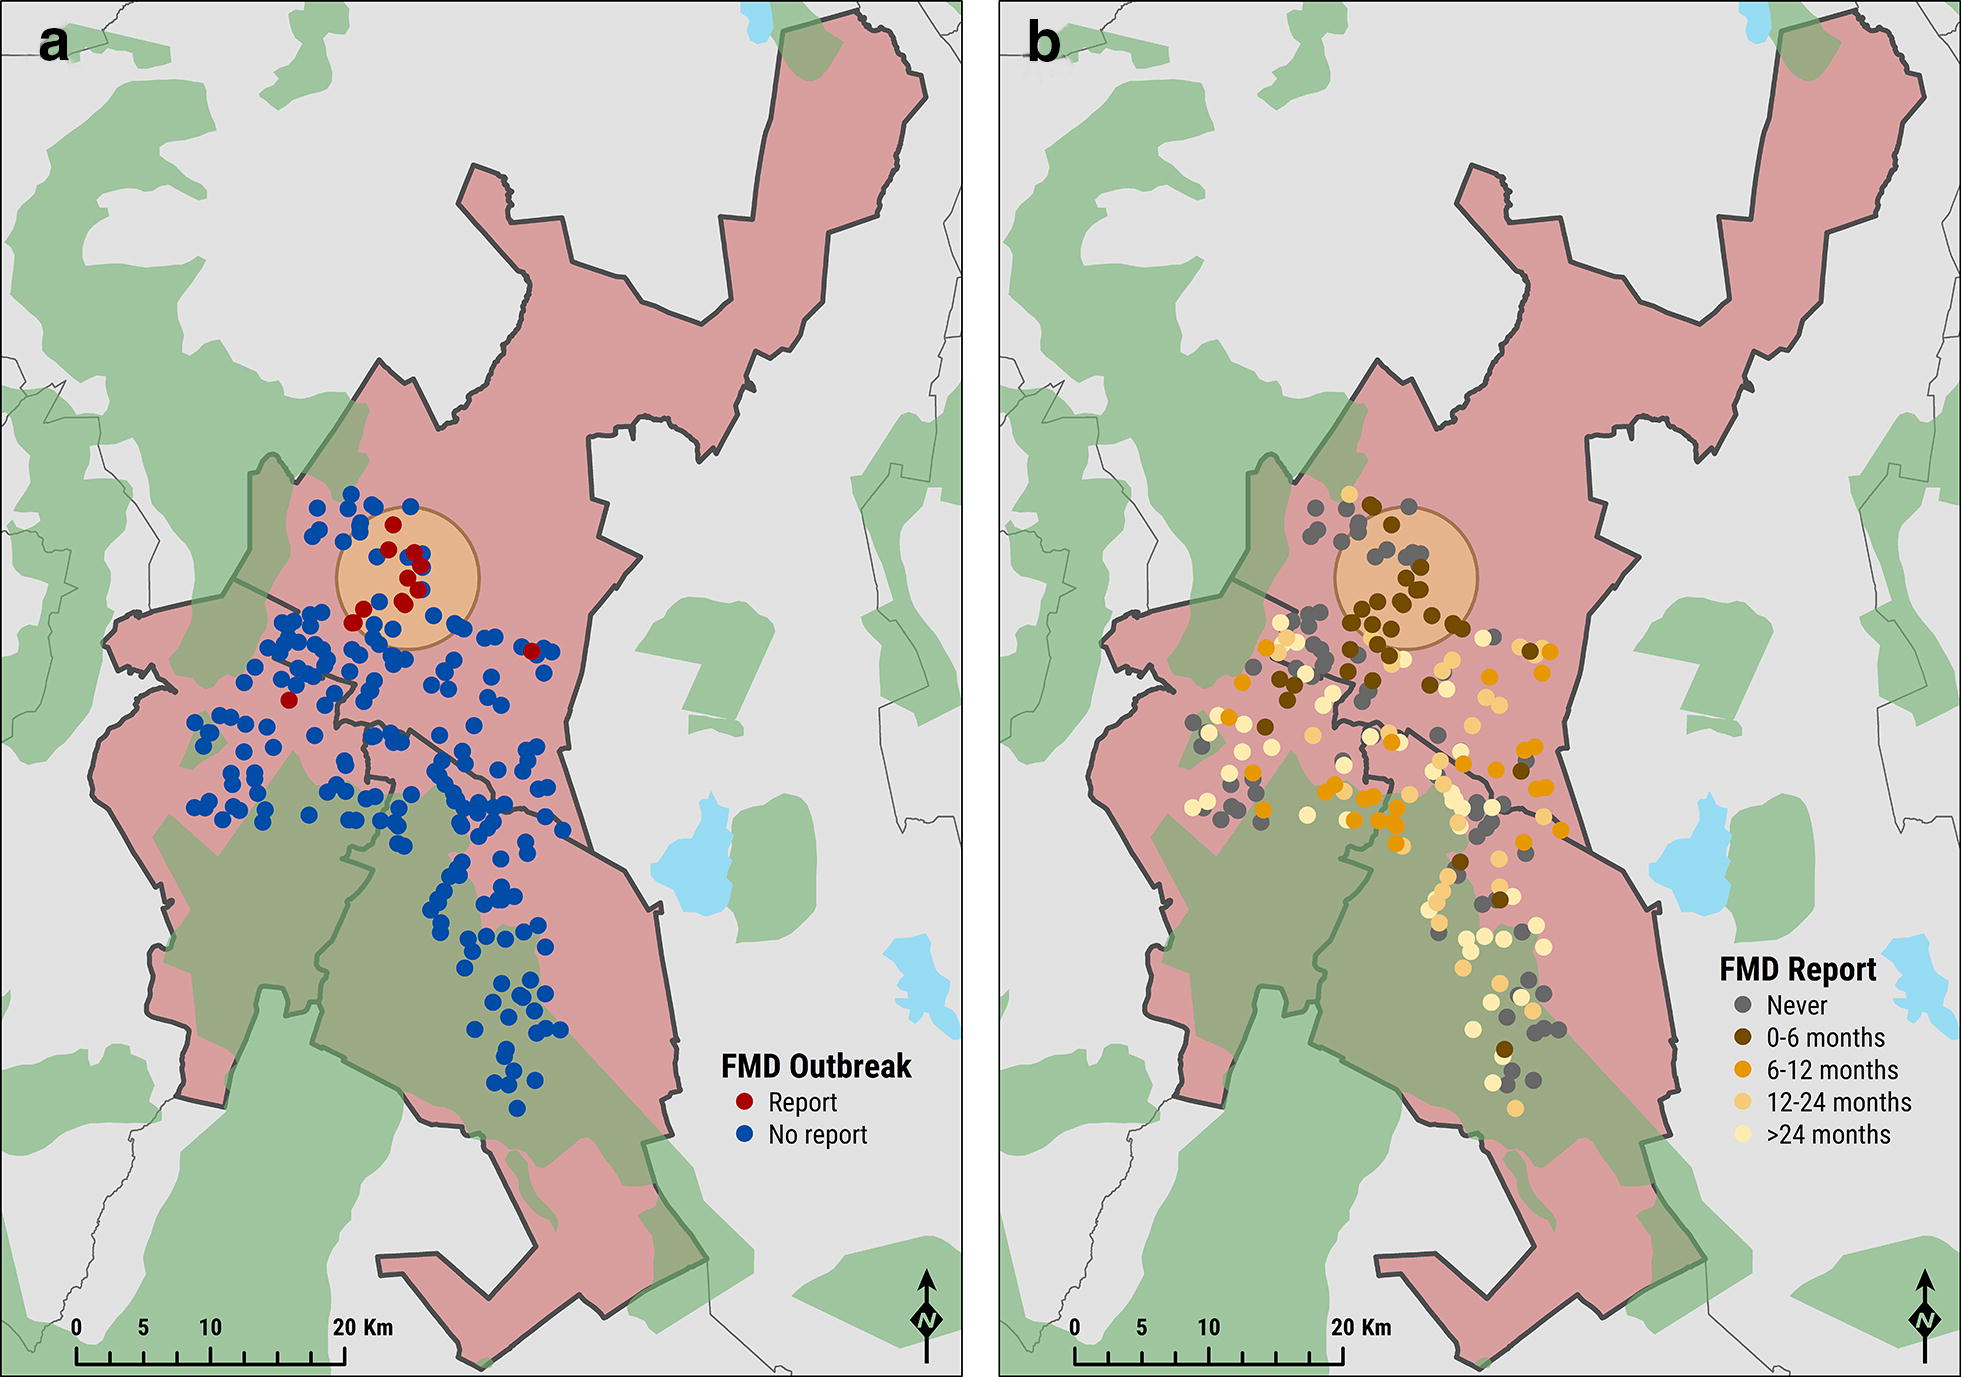
Figure 3.

Map of occurrence of FMD cases. Farmer reported FMD outbreak locations within the study area are represented in red in A, whilst the distribution of farmer reported FMD occurrence reported during the survey is reported in B. The geographical cluster of cases is also shown (light orange colour).
