Fig. 1.
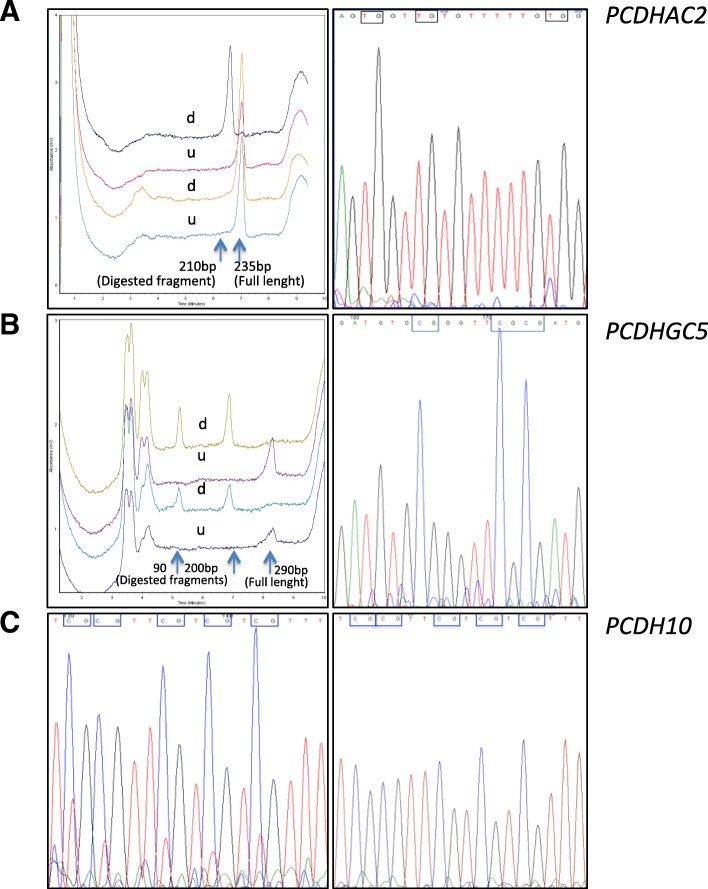
Examples of methylation analysis of PDAC cases. Panels a and b include COBRA (left) and BGS (right) analyses. In COBRA analyses, the upper two chromatograms show the digested (d) and undigested (u) methylated control, while the bottom two chromatograms (d and u) correspond to a representative case. Panel C shows BGS analyses of a representative case and a PCDH10-methylated cell line. a PCDHAC2. COBRA analysis shows only the full-length fragment (235 bp) in the digested sample (d) indicating the absence of CpG methylation in the case (bottom), while the corresponding methylated control (d) showed only a 210 bp fragment indicating complete digestion (top). BGS analysis confirms a substantial lack of CpG methylation, albeit one CpG dinucleotide shows a minor C peak indicating modest methylation that was also observed in non-neoplastic tissue. b PCDHGC5. COBRA analysis reveals CpG methylation as indicated by the complete cut the full-length fragment (290 bp) in two fragments (200 and 90 bp) of the digested (d) samples deriving from a representative case (bottom) and the methylated control (top). BGS analysis confirms that CpG dinucleotides are methylated. c PCDH10. Left. BGS analysis in a representative case shows major C peaks together with minor T peaks in CpG dinucleotides indicating preponderant methylation of the island. Right. BGS analysis of Capan-2 cell line shows that all CpG dinucleotides are fully methylated

