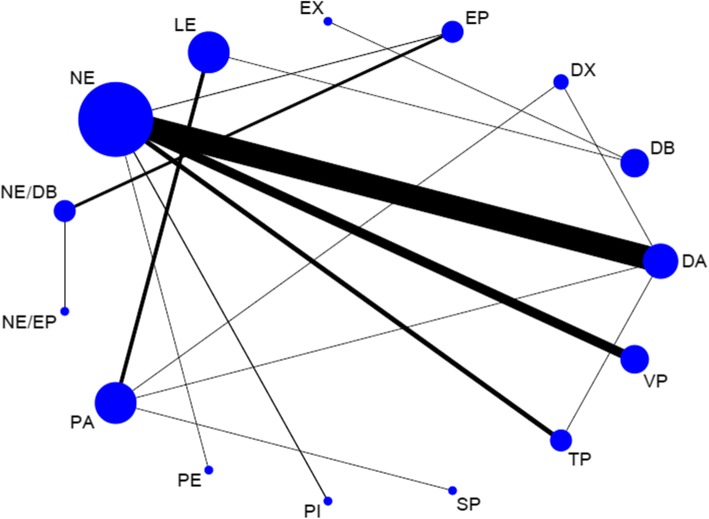
Fig. 3.
Network geometry. Network of all the included treatment agents for evaluating mortality. The size of the nodes was proportional to the number of patients randomized to each modality and thickness of the lines to the number of direct comparisons. For example, the circle area for NE was the largest, and the edge between NE and DA was much wider, indicating that the number of studies on NE was the highest, and the direct comparisons between NE and DA were the most common in the existed literatures

