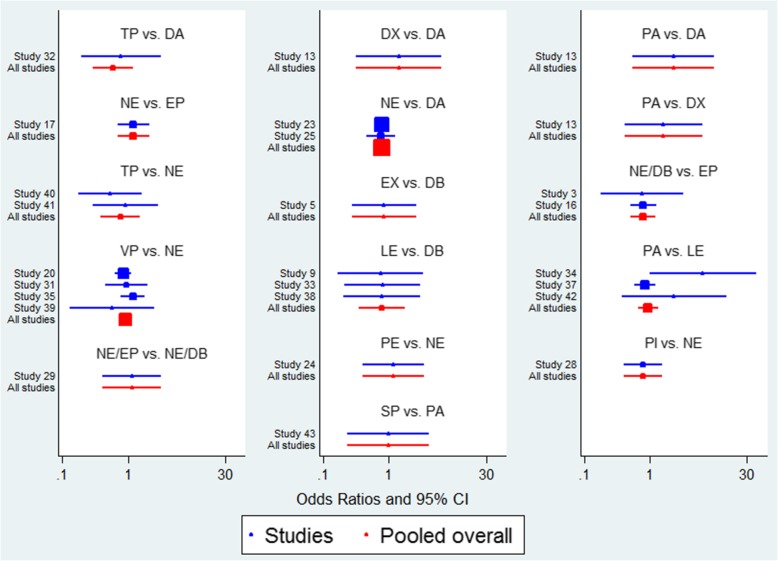
Fig. 5.
Forest plot in direct comparisons for evaluation of 28-day mortality. A blue line represents a single RCT study comparing two vasoactive medications, and a red line synthesizes multiple of studies that compared these two medications. Line length indicates the confidence interval of the results. A shorter line corresponds to larger sample size and potentially more reliable results. Solid box quantifies the relative contribution of the specific study to the overall meta-analysis, where larger box corresponds to larger contributions. Number 1 on the x-axis is the null value for OR = 1. The site of the spot to the left or right of 1 on the horizontal axis represents the favorable tendency to reduce 28-day mortality. The study which the ID number in the figure corresponds to is shown in Table 1

