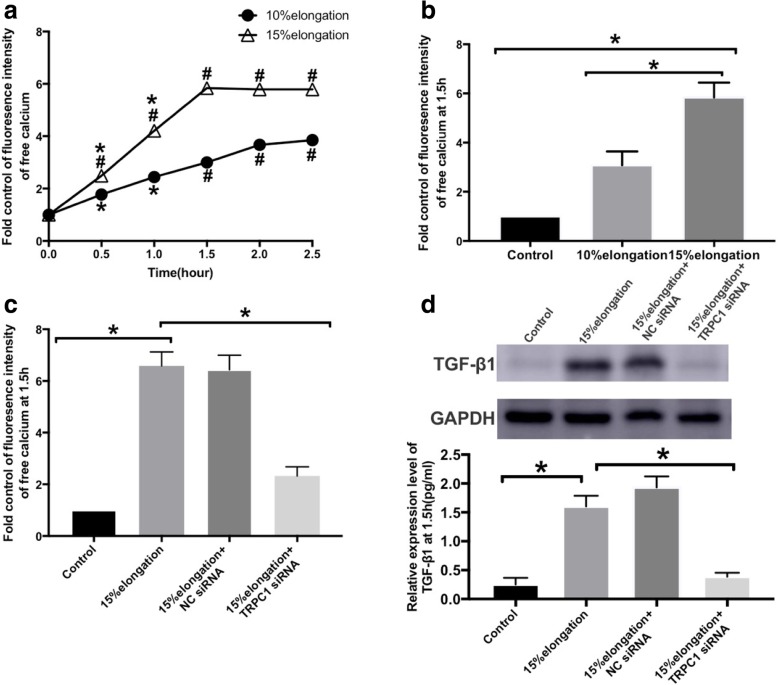
Fig. 2.
The level of Ca2+ fluorescence intensity after mechanical stretch was observed using. Laser confocal microscopy. The fluorescence intensity was shown by fold control. a 16HBE. were cells stretched for 0, 0.5, 1, 1.5, 2, and 2.5 h at 10 and 15%. #P < 0.05 versus. Control group (cells stretched for 0 min); and *P < 0.05 versus cells stretched for 1.5 h. b Cells were stretched for 1.5 h at different levels of elongation. *P < 0.05. c The effect of. TRPC1 siRNA on intracellular Ca2+ flux under 15% elongation for 1.5 h. * P < 0.05. In stretch.v group, 15% elongation for 1.5 h was chosed for further experiment. d Expression level of TGF-. β1 was measured at 15% elongation for 1.5 h by western blot. Values are means ± SD (n = 3). *. P < 0.05

