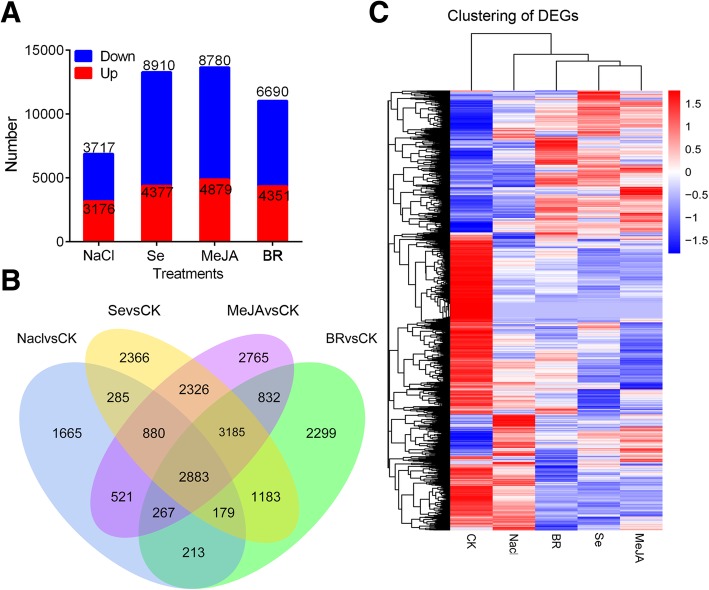
Fig. 3.
The distribution of differentially expressed genes (DEGs) induced by different treatments. a and b, the distribution of DEGs induced by different treatments and the venn figure, respectively. c clustering analysis of the DEGs. Blue, downregulated. Red, upregulated. MeJA, methyl jasmonate; Se, sodium selenite, BR, brassinolide

