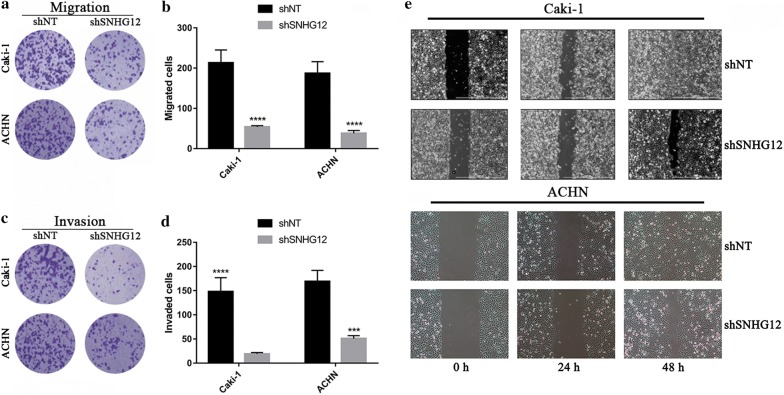
Fig. 3.
SNHG12-silencing suppressed migration and invasion of renal cancer cells. a, b The migratory capacity was evaluated using transwell chamber. The representative images were shown in a and the statistical results in b. ****p < 0.0001. c, d The invasive capacity of indicated cells were determined in Matrigel-coated transwell assay. The representative images were shown in c and the statistical results in d. ***p < 0.001, ****p < 0.0001. e Scratch closure assay was performed to assess migration in SNHG12-deficient Caki-1 (top pane) and ACHN cells (bottom pane). The wound closure rate was monitored at 0, 24 and 48 h respectively

