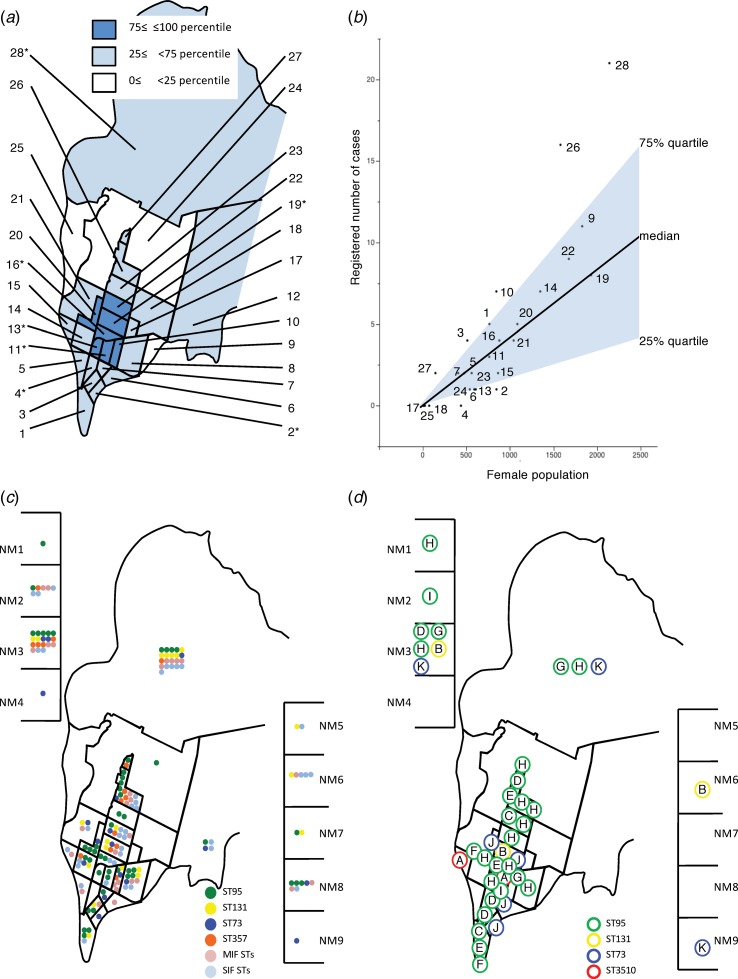
Fig. 5.
Schematic maps of the City of Takikawa by districts and neighbouring municipalities April 2011–March 2012. (a): Districts classified by population density expressed as the quartiles. (b): Relationship between the registered number of cases and female population of each district. District identification numbers are in accordance with those of Part A. NM denotes neighbouring municipalities. *, The districts where the participated clinics or hospitals are located. Part C: Distributions of STs, classified into four (ST95, ST131, ST73, ST357) high-isolation-frequency, middle-isolation-frequency (MIF) or single-isolation-frequency (SIF) STs. Part D: Distributions of CRGs, which are identified by letters in circles. NM denotes neighbouring municipalities. Members of CRG H were isolated from 11 different districts or neighbouring cities, whereas only one district had only two isolates with an 11-month interval.

