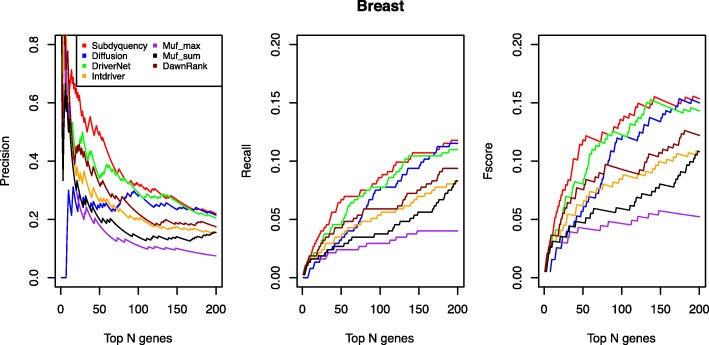
Fig. 3.
Prediction performance Comparison of each method for breast cancer in terms of Precision, Recall and Fscore values. The figure shows the comparison for breast cancer of precision, recall and fscore for top ranking genes in the seven methods. The X-axis represents the number of top-ranking genes. The Y-axis represents the score of the given metric

