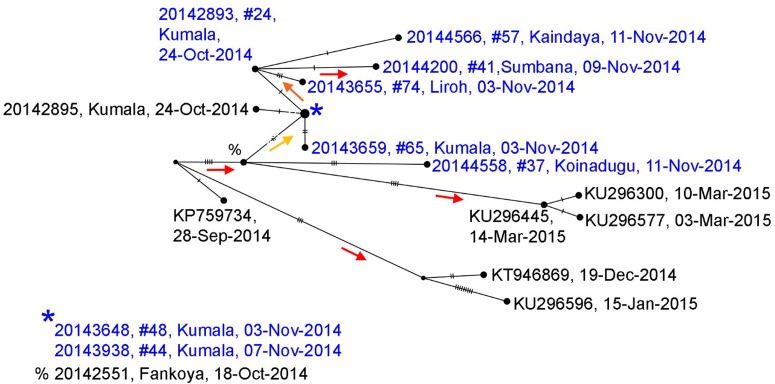
Fig. 4.
Median joining haplotype network based on full genome sequences generated from samples collected in Nieni Chiefdom, Koinadugu district, Sierra Leone, 2014. Viral sequences were selected from the Nieni-specific clade and closely related clades from a maximum likelihood tree constructed with all available Ebola sequences (Supplementary Figs. 1 and 2). Nodes are placed according to sample collection dates and scaled to represent number of identical sequences. Individuals included in the transmission tree (Fig. 4) are highlighted in blue. Nodes without labels represent hypothetical ancestors and vertical hash marks represent number of nucleotide changes. Statistical support (aLRT from maximum likelihood trees) for nodes is indicated by coloured arrows which point to supported nodes: red >0.9, orange >0.8, yellow >0.75.

