FIGURE 4.
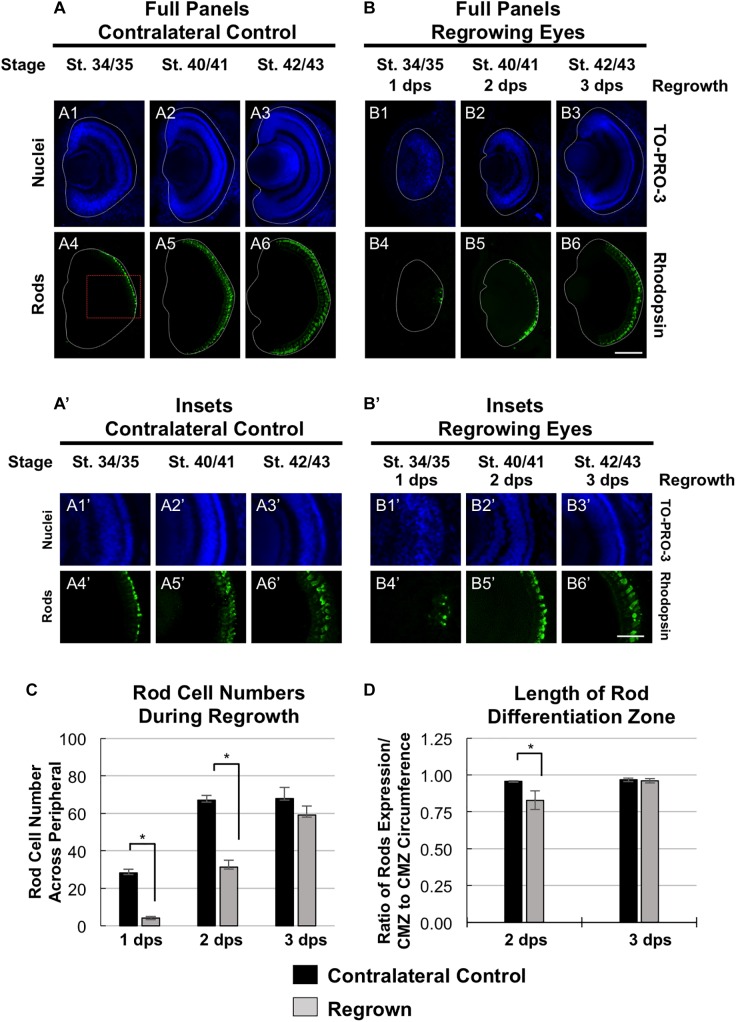
Regrown eyes regain rod differentiation by 3 dps. Images shown are immunostained, transverse sections at three developmental timepoints corresponding to 1, 2, and 3 days post surgery (dps). (A,B) Differentiation of rod photoreceptor cells is delayed during 1, 2 dps but regains patterning that is comparable to contralateral control eyes (unoperated) by 3 days. White dashed lines delineate each eye. (A’,B’) Images shown in panels A’ and B’ correspond to the region shown in the inset box in panel A4 for the corresponding A or B panel at high magnification. Blue color indicates nuclear staining (TO-PRO-3). Green color indicates anti-Rhodopsin signal (rod photoreceptors). Sample sizes: 1 day, n = 5; 2 days, n = 7; and 3 days, n = 7. (A,B, A’,B’) Up = dorsal, down = ventral, lens is on the left. Scale bar: A,B = 100 μm and A’,B’ = 50 μm. (C) Quantification of rod photoreceptor cells in the regrowing eye structure at three developmental timepoints corresponding to 1, 2, and 3 dps. The number of rod photoreceptors per 60 μm section in the regrown eye is comparable to number of rod photoreceptor cells in the contralateral control eyes by 3 dps. ∗denotes p < 0.05 (n > 5 per timepoint). Data are means ± SEM. (D) Rod photoreceptor cells expression pattern was measured and compared to the overall circumference of the retinal layer from one end of the ciliary margin zone (CMZ) to the end of the opposite CMZ in both regrowing and contralateral eyes. The ratio of rhodopsin expression in the retinal layer over the retinal layer circumference measurements is shown. By 3 dps, the rod photoreceptor cell expression is comparable to the contralateral control eye. ∗denotes p < 0.05 (n > 6 per timepoint). Data are means ± SEM.

