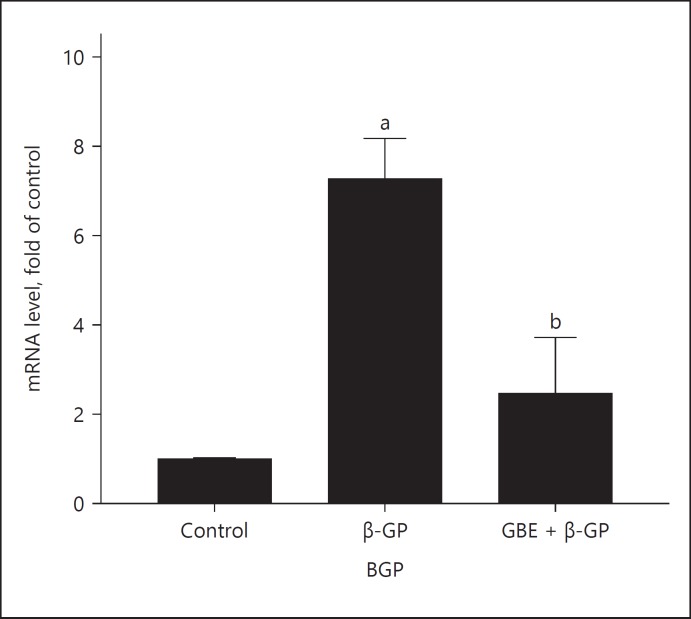
Fig. 6.
mRNA expression of BGP: Ctrl (control group); β-GP (β-GP group); GBE + β-GP (GBE and β-GP group). Results are presented as β-GP group compared with the control group, ap < 0.05; GBE and β-GP compared with the β-GP group, bp < 0.05. Representative images are shown (n = 3). BGP, bone gamma-carboxyglutamic-acid-containing proteins.

