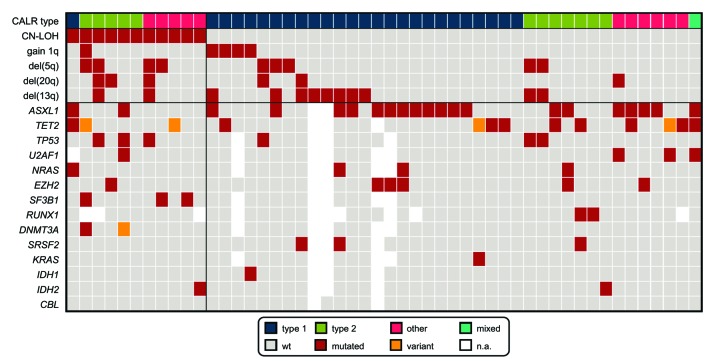
Figure 1.
Summary of accompanying cytogenetic and molecular genetic aberrations. The result of each analysis is depicted for the total cohort of 50 cases; each column represents one patient. Type 1, type 2, other, and mixed (type 1 and type 2) denote the respective CALR types. wt: wild-type; n.a.: not analyzed.

