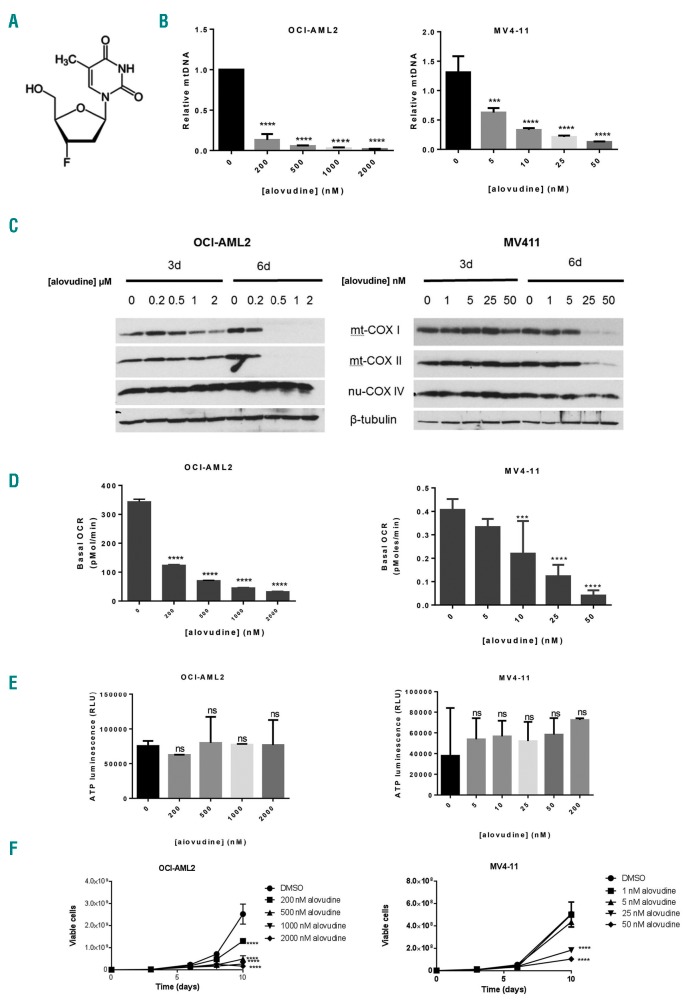
Figure 1.
Alovudine inhibits mitochondrial DNA biosynthesis and oxidative phosphorylation in acute myeloid leukemia (AML). (A) Alovudine’s chemical structure. (B) OCI-AML2 and MV4-11 cells were treated with increasing concentrations of alovudine for 6 days. Relative mitochondrial DNA (mtDNA) content was assessed by qRT-PCR as described in the Methods section. Data represent mean+Standard Deviation (SD) mtDNA relative to untreated controls from one of three representative experiments. (C) OCI-AML2 and MV411 were treated with increasing concentrations of alovudine. Three and 6 days after treatment, cells were harvested, lysed and levels of cytochrome C oxidase subunits: mitochondrial COXI (mt-COX1), mitochondrial COXII (mt-COXII), nuclear COX IV (nu-COX IV), and ®-tubulin were measured by immunoblotting. The immunoblot from one of three representative experiments is shown. (D) Basal oxygen consumption rate (OCR) was assessed in OCI-AML2 and MV411 cells following 6 days of alovudine treatment, using the Seahorse XF96 Metabolic Flux Assay. Data represent the mean±SD basal OCR from one of three representative experiments. n=6. (E) OCI-AML2 and MV411 cells were treated with increasing concentrations of alovudine for 6 days. ATP production was assessed by CellTitre-Glo Luminescent Cell Viability Assay. Data represent the mean±SD from two independent experiments in triplicate. (F) OCI-AML2 and MV411 cells were treated with increasing concentrations of alovudine. Cell growth and viability was assessed by trypan blue exclusion staining at increasing times after incubation. Data represent the mean±SEM from one of three representative experiments. For all experiments, ***P<0.001 and ****P<0.0001 using Dunnett’s multiple comparisons test after one-way ANOVA (B, D and E). (F) Two-way ANOVA.

