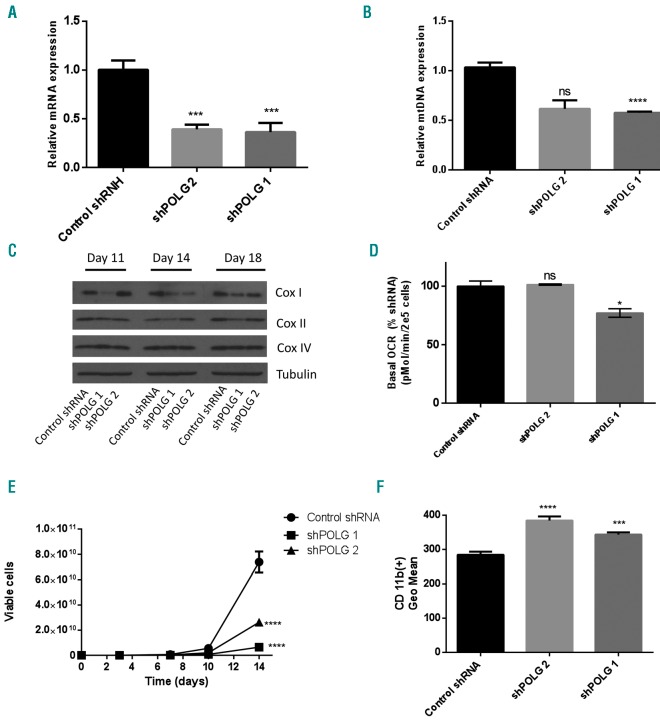
Figure 6.
Polymerase gamma (POLG) knockdown promotes acute myeloid leukemia differentiation. OCI-AML2 cells were infected with shRNA targeting POLG or a control sequenced in lentiviral vectors. (A) POLG knockdown at 14 days post transduction was assessed by qRT-PCR. Data represent the mean+Standard Deviation (SD) mtDNA from one of three representative experiments. (B) Relative mitochondrial DNA (mtDNA) content was assessed by qRT-PCR 14 days post transduction with POLG shRNA, as described in the “Methods” section. Data represent the mean+Standard Error of Mean (SEM) from two independent experiments. (C) Cells were harvested 11, 14 and 18 days post POLG knockdown and levels of cytochrome C oxidase subunits: mitochondrial COXI (mt-COX1), nuclear COX IV (nu-COX IV), and β-tubulin in whole-cell extracts were measured by immunoblotting. The immunoblot from one of three representative experiments is shown. (D) Basal oxygen consumption rate (OCR) was assessed 10 days following POLG knockdown, using the Seahorse XF96 Metabolic Flux Assay. Data represent Mean±SEM basal OCR from two independent experiments; n=6. (E) Cell growth and viability were assessed by trypan blue exclusion staining. Data represent the mean±SD from one of three representative experiments. (F) CD11b expression was assessed by flow cytometry. Data represent the mean±SD from one of three representative experiments. For all experiments, *P<0.5, **P<0.01, ***P<0.001, and ****P<0.0001 using Dunnett’s multiple comparison following one-way ANOVA (A and F) or two-way ANOVA (B and D). (E) Two-way ANOVA test.

