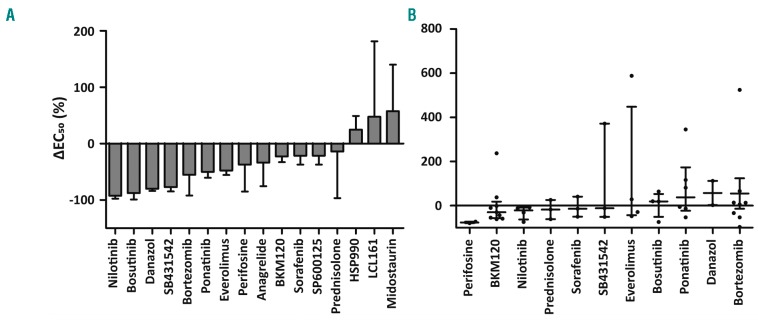
Figure 1.
Effect of each drug in combination with 100 nM ruxolitinib in BA/F3 JAK2-V617F3 cell line (A) or in patients’ peripheral blood mononuclear cells (B). y-axis: the increment between the EC50 for each drug in the presence of ruxolitinib minus its EC50 in monotherapy. Results are expressed as the mean±Standard Deviation (SD) of 2 independent experiments in cell lines (A) and median and interquartile range in patients’ samples (B).

