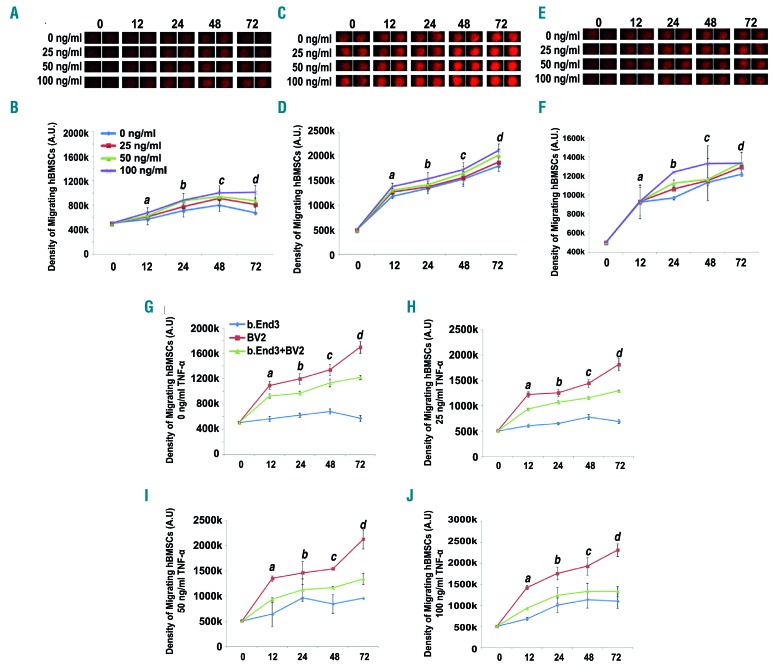
Figure 7.
Migration of human bone marrow mesenchymal stromal cells to bEnd.3, BV2, and bEnd.3+BV2 cells in cell migration assays. (A-F) Human bone marrow mesenchymal stromal cells (hBMSC) migrate to three experimental groups: lymphoid endothelial cells (bEnd.3) (A and B), microglia (BV2) (C and D), and a combination of BV2+bEnd.3 cells (E and F). Cell density was measured over time (0-72 h) and in response to varying doses of tumor necrosis factor alpha (TNF-α: 0 ng/mL, 25 ng/mL, 50 ng/mL, or 100 ng/mL). Compared with the non-treated control group, TNF-α significantly increased the number of migrating hBMSC, indicating that TNF-α plays a critical role in the migration of hBMSC in vitro. (A, C, E) Visualization of the density of hBMSC migrating to bEnd.3 (A), BV2 (C), and bEnd.3+BV2 (E) over time and in response to increasing TNF-α doses. (B, D, F) Quantitative analyses of the density of hBMSC migrating to bEnd.3 (B), BV2 (D), and bEnd.3+BV2 (F) over time and in response to increasing TNF-α doses. Significance values: (A) a: 0 ng/mL vs. 25 ng/mL (P<0.05); 0 ng/mL vs. 50 ng/mL (P<0.05). b: 0 ng/mL vs. 25 ng/mL (P<0.05); 0 ng/mL vs. 50 ng/mL (P<0.05). c: 50 ng/mL vs. 100 ng/mL (P<0.05). d: 25 ng/mL vs. 50 ng/mL (P<0.01); 50 ng/mL vs. 100 ng/mL (P<0.01). (B) a: 0 ng/mL vs. 50 ng/mL (P<0.05); 25 ng/mL vs. 100 ng/mL (P<0.05). b: 25 ng/mL vs. 100 ng/mL (P<0.05); 50 ng/mL vs. 100 ng/mL (P<0.05). c: 0 ng/mL vs. 50 ng/mL (P<0.05); 25 ng/mL vs. 50 ng/mL (P<0.05); 25 ng/mL vs. 100 ng/mL (P<0.05). d: 25 ng/mL vs. 100 ng/mL (P<0.05). (C) a: 25 ng/mL vs. 100 ng/mL (P<0.05). b: 0 ng/mL vs. 100 ng/mL (P<0.05); 25 ng/mL vs. 50 ng/mL (P<0.05). c: 0 ng/mL vs. 50 ng/mL (P<0.05); 0 ng/mL vs. 100 ng/mL (P<0.05); 25 ng/mL vs. 50 ng/mL (P<0.05). d: 0 ng/mL vs. 50 ng/mL (P<0.01); 25 ng/mL vs. 50 ng/mL (P<0.01); 50 ng/mL vs. 100 ng/mL (P<0.01). (G-J) hBMSC preferentially migrate to BV2 microglial cells in cell migration assays. Quantitative comparisons between the amount of hBMSC migrating to BV2, bEnd.3, and BV2+bEnd.3 over time and within specific doses of TNF-α [0 ng/mL (G), 25 ng/mL (H), 50 ng/mL (I), and 100 ng/mL (J)]. The number of migrating hBMSC was highest for BV2 for all doses of TNF-α, indicating how hBMSC preferentially migrate to BV2. The density of migrating hBMSC was significantly higher for BV2 than for bEnd.3 and BV2+bEnd.3 for all TNF-α doses. There were significantly more migrating hBMSC for bEnd.3+BV2 than for bEnd.3 for all TNF-α doses. Significance values: (G) a: b.End3 vs. b.End3+BV2 (P<0.05). b: BV2 vs. b.End3+BV2 (P<0.05). c: BV2 vs. b.End3+BV2 (P<0.05). d: BV2 vs. b.End3+BV2 (P<0.05). (H) a: b.End3 vs. BV2 (P<0.001); b.End3 vs. b.End3+BV2 (P<0.001); BV2 vs. b.End3+BV2 (P<0.001). b: BV2 vs. b.End3+BV2 (P<0.05). c: BV2 vs. b.End3+BV2 (P<0.05). d: BV2 vs. b.End3+BV2 (P<0.05). (I) a: b.End3 vs. BV2 (P<0.001); b.End3 vs. b.End3+BV2 (P<0.001); BV2 vs. b.End3+BV2 (P<0.001). b: b.End3 vs. BV2 (P<0.01); b.End3 vs. b.End3+BV2 (P<0.01); BV2 vs. b.End3+BV2 (P<0.01). c: BV2 vs. b.End3+BV2 (P<0.01). d: b.End3 vs. b.End3+BV2 (P<0.05). (J) a: b.End3 vs. b.End3+BV2 (P<0.05). b: b.End3 vs. BV2 (P<0.001); b.End3 vs. b.End3+BV2 (P<0.001); BV2 vs. b.End3+BV2 (P<0.001). c: b.End3 vs. b.End3+BV2 (P<0.01). d: b.End3 vs. b.End3+BV2 (P<0.05).

