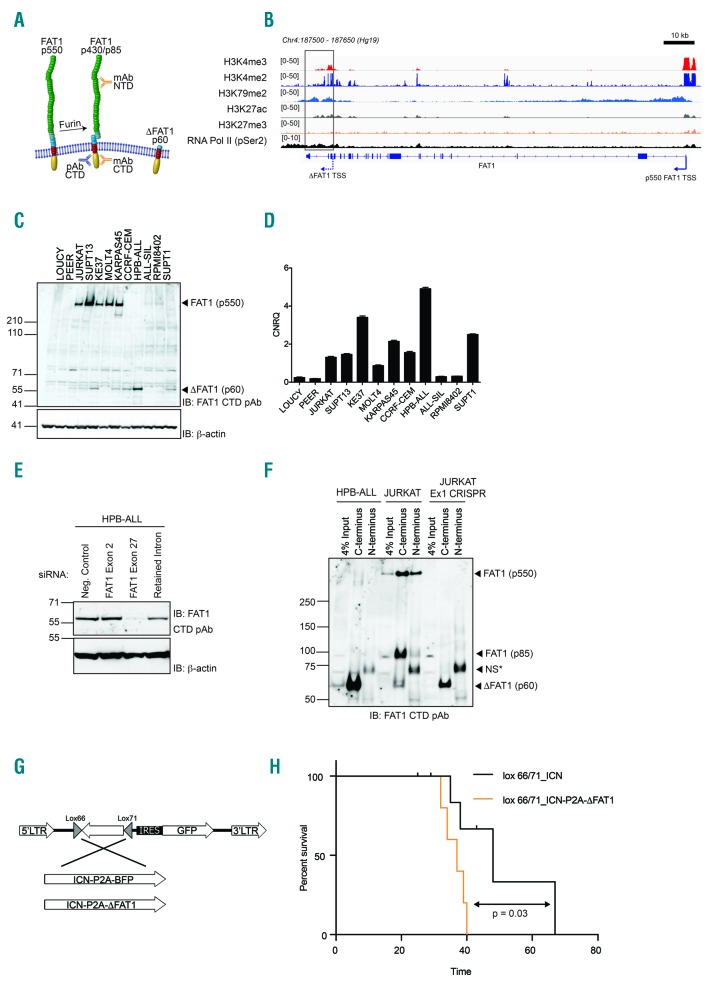
Figure 2.
The truncated ΔFAT1 transcript produces a protein independent of full-length FAT1. (A) Schematic showing the full-length FAT1 (p550) protein which undergoes furin-mediated cleavage to produce a (p450/p85) heterodimer alongside the predicted truncated ΔFAT protein. (B) Chromatin immunoprecipitation-sequencing data for histone marks and RNA-pol II (pSer2 C-terminal domain) across the FAT1 genetic locus in the Jurkat cell line. The transcriptional start sites (TSS) for FAT1 and ΔFAT1 are highlighted. (C) Western blot analysis of a panel of T-ALL cell lines using an antibody directed against the cytoplasmic tail of FAT1 identified both full-length p550 FAT1 and a specific band migrating at the predicted molecular weight for ΔFAT (p60). (D) Real-time polymerase chain reaction analysis of the levels of ΔFAT1 mRNA transcript reconciles directly with the Western blot analysis. (E) HPB-ALL cells only express the ΔFAT1 protein and siRNA directed toward exon 27 (the cytoplasmic tail) ablated expression while siRNA directed toward exon 2 of FAT1 was equivalent to a negative control. A siRNA directed toward the small intronic sequence also reduced the expression of ΔFAT1. (F) CRISPR/Cas9-mediated knockout of FAT1 using a guide RNA directed toward exon 1 completely removed full-length FAT1 (p550) protein expression but did not reduce ΔFAT1 p60 expression in Jurkat cells. HPB-ALL cells exclusively expressed ΔFAT which was only detected after immunoprecipitation using C-terminal but not N-terminal directed antibodies (*NS = nonspecific band). (G) Schematic representation of the inducible retroviral constructs used to express either ICN or ICN and ΔFAT1 in the presence of Cre-recombinase. (H) Bone marrow transplant survival curve for CD2-Cre-driven expression of either ICN only or ICN and ΔFAT1 in early T-cell progenitors (log-rank, Mantel-Cox test, P=0.03).

