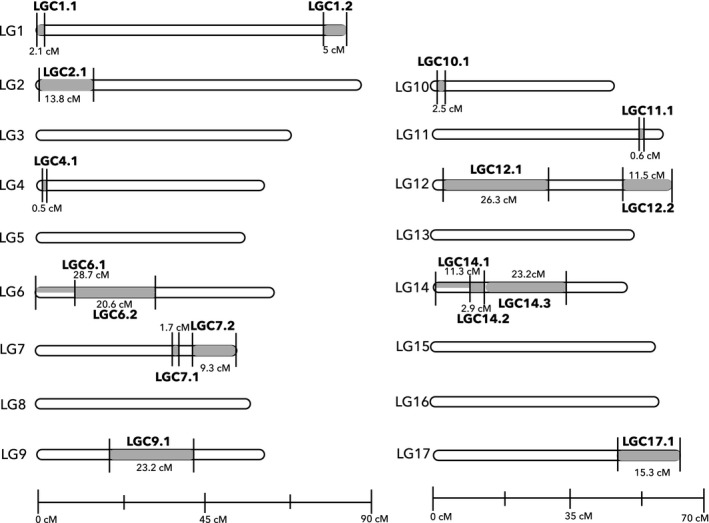
Figure 3.

Distribution of the LD clusters (grey) identified with the network‐based analysis of LDna and filtered based on the PCA. Codes and approximate sizes of the candidate rearrangements are shown based on the information from Table 1. Linkage groups (white) were ordered based on the number of SNPs contained in each (high to low from LG1 to LG17, respectively). Part grey, part white indicates the overlapping inversions on LG6 and LG14
