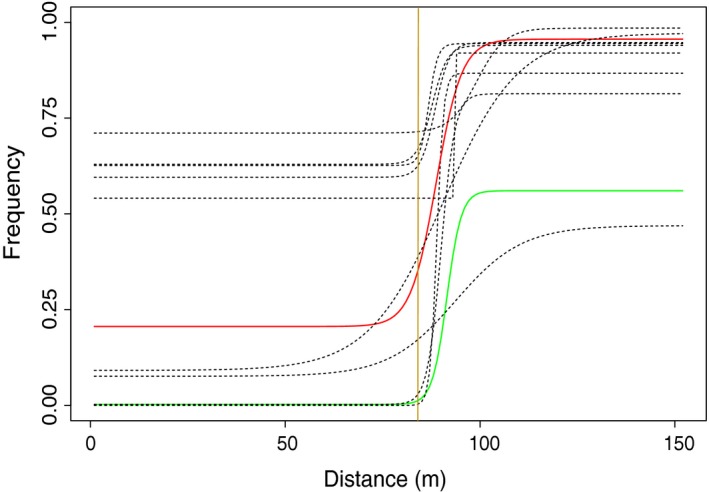
Figure 6.

Inversion frequencies across the transect. Predicted frequencies (dashed lines) for the 11 inversions that fitted a clinal model (∆AIC > 10) across the sampled transect (x‐axis). The clines for two inversions that contain many outlier SNPs (Westram et al., 2018) are highlighted: LGC17.1 (green) and LGC6.1 (red). The main habitat transition is shown (orange vertical line)
