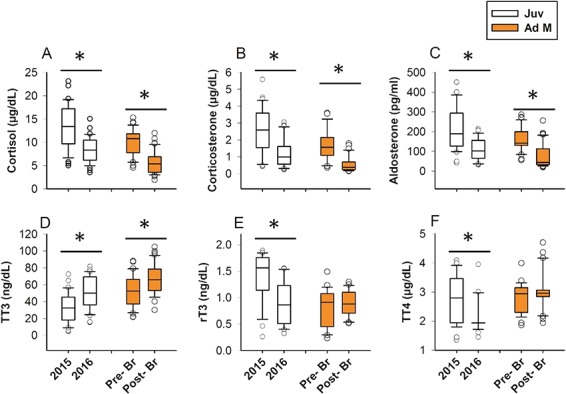
Figure 4.

Box plots depicting stress and thyroid hormone concentrations across the years 2015 and 2016 in juveniles (Juv) and the 2016 summer breeding season in adult males (Ad M). Pre- Br: pre-breeding season; Post- Br: post-breeding season. Central lines in boxes are medians, and whiskers are 95% confidence intervals with outliers. *grouped by a horizontal line denotes significant differences between years or seasons separately for each age class according to post-hoc Student’s t-tests (P < 0.05).
