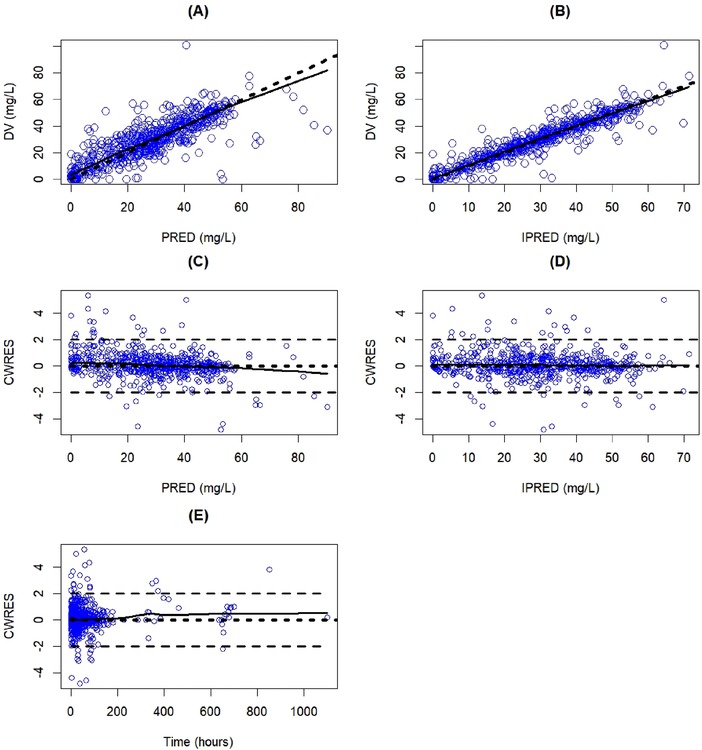
Figure 1.

Goodness‐of‐fit plots of the final population pharmacokinetic model. The dashed lines represent the identity line in (A) and (B). The horizontal lines at −2, 0, and 2 represent the CWRES in (C), (D), and (E). The solid lines represent a Loess smoothed line. Blue circles indicate model‐predicted values. CWRES, conditional weighted residual; DV, dependent variable (observed change from baseline magnesium concentration); PRED, population‐predicted change from baseline magnesium concentration; IPRED, individual‐predicted change from baseline magnesium concentration.
