
Figure 1.
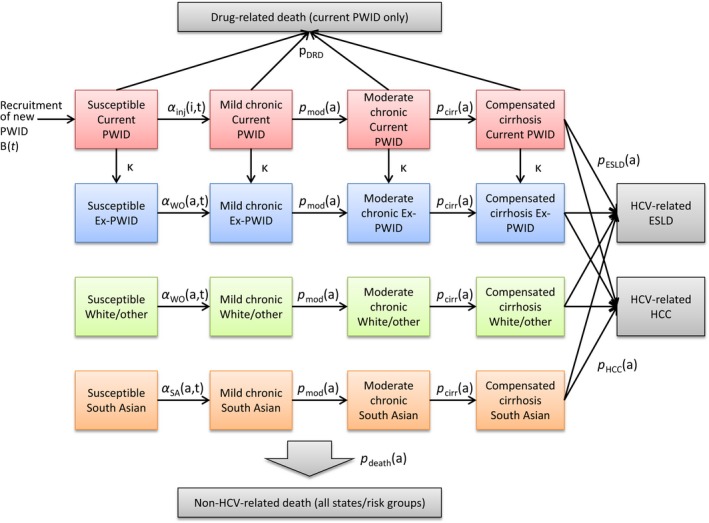
Risk group and disease state structure of the model. For simplicity, transitions to non‐HCV, non‐drug‐related death (which may occur while in any state) are not explicitly shown. Observed data are available for HCV‐related ESLD and HCC; these are not broken down by risk group. State transition probabilities: Parameters are indexed by age (a), time (t) and injecting duration (i). α inj(i,t) = infection in people who inject drugs (PWID: those currently injecting or who have temporarily ceased to inject); α WO(a,t) = infection in white/other never‐PWID, and ex‐PWID; α SA(a,t) = infection in South Asian never‐PWID; κ = permanent injecting cessation; pDRD = drug‐related death; pdeath(a) = non‐drug‐related death; pmod(a) = progression to moderate chronic state; pcirr(a) = progression to compensated cirrhosis state; pESLD(a) = progression to HCV‐related end‐stage liver disease; pHCC(a) = progression to HCV‐related hepatocellular carcinoma