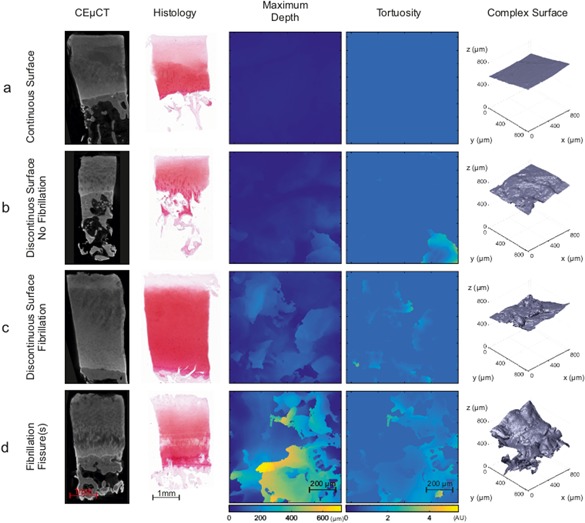
Figure 3.

Representative CEμCT slice and corresponding histology from osteochondral plugs with different OA degeneration stages a) Smooth and continuous AC surface with no distinguishable features in parameter maps or 3D surface. b) Discontinuities in AC surface with a cavern‐like structure in the tortuosity map and discernable patterns in a Maximum Void Depth (MVD) map and 3D surface. c) Fibrillation with distinct changes in both MVD and Tortuosity; more areas with surface complexity can be seen on the 3D surface. d) Severe degeneration can be seen in the MVD and tortuosity maps as well as on the 3D surface with very complex defects penetrating to deep AC.
