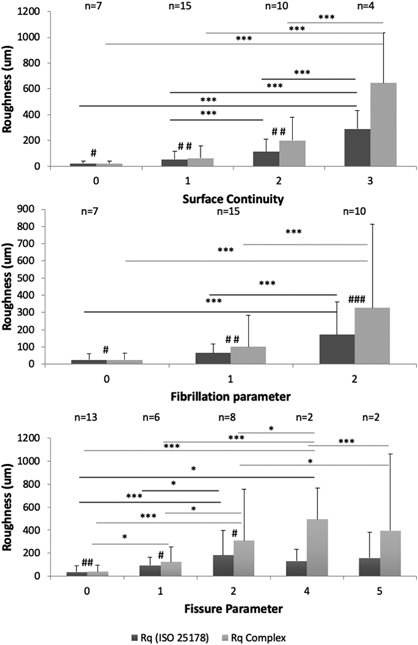
Figure 6.

Complex Roughness (CRq) and ISO 25178 Roughness (Rq) plotted as functions of reference parameters, which are defined as following: Surface Continuity (Smooth and continuous = 0; Slightly discontinuous = 1; Moderately discontinuous = 2; Severely discontinuous = 3), Fibrillation (Absent = 0; Few = 1; Many = 2) and Fissure (Zone 1 absent = 0; Zone 1 present = 1; Zone 2 top half present = 2; Zone 2 lower half present = 3; Zone 3 top half present = 4; Zone 3 lower half present = 5). Dark gray presents standard Rq and light gray actual complex surface roughness described by CRq. For linear main effects in mixed models *p < 0.05; **p < 0.005 and ***p < 0.001 and for pairwise Wilcoxon test #p < 0.05; ##p < 0.005 and ###p < 0.001. These results show that realistic CRq roughness values are significantly larger than Rq that underestimates the actual complex surface roughness. Furthermore, CRq significant difference between intact and slightly fissured cartilage surface.
