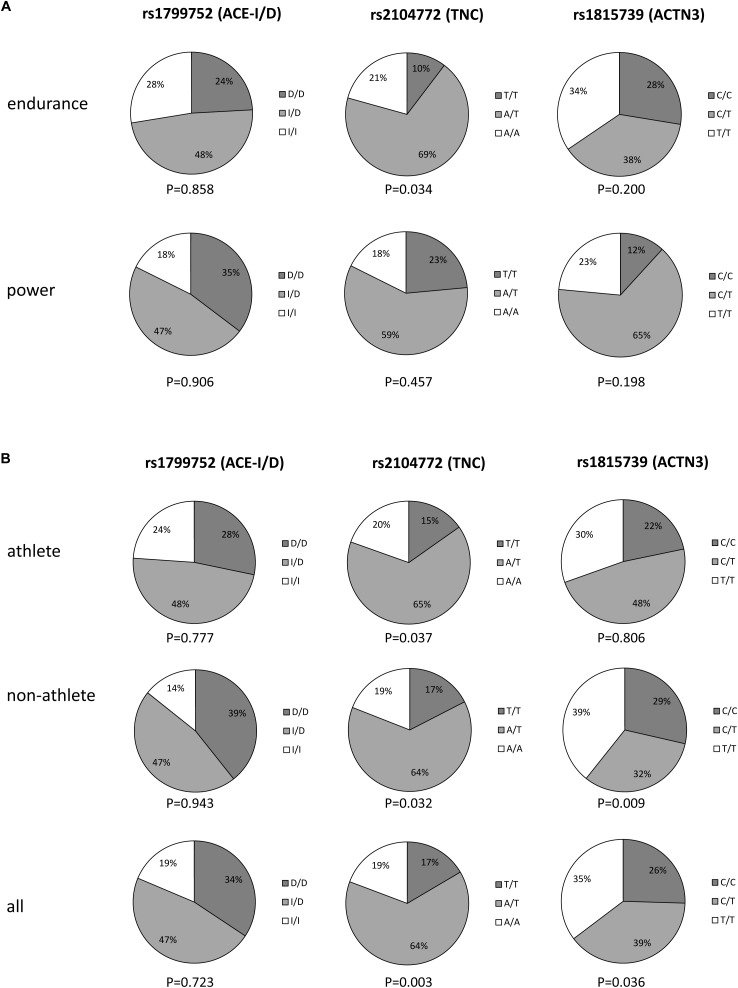
FIGURE 1.
Fractions of the individual genotypes within the phenotypes. Pie chart displaying the distribution of the three genotypes in the two athlete types (A), and athletes, non-athletes and all subjects combined (B). p-values below each chart refer to the respective significance of the test for Hardy–Weinberg equilibrium.

