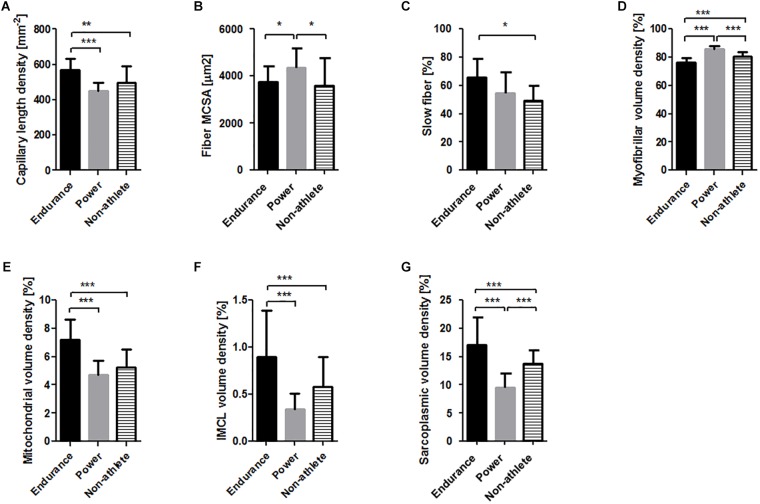
FIGURE 2.
M. vastus lateralis composition in the three phenotypes. Bar graphs visualizing the mean and standard deviation of the (A) capillary length density, (B) muscle fiber MCSA, (C) slow type fiber percentage, and volume densities of myofibrils (D), mitochondria (E), intramyofibrillar lipid (F) and sarcoplasma (G). Asterisk indicates significant difference. ∗p < 0.05, ∗∗∗p < 0.001.

