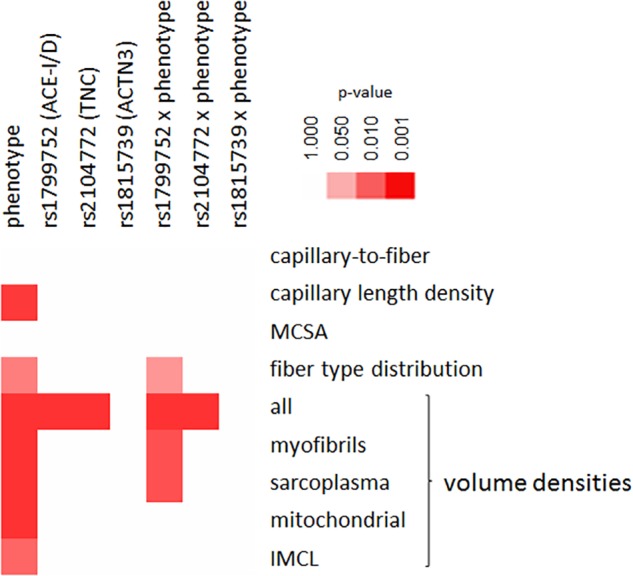
FIGURE 3.

Genotype × phenotype interactions on muscle composition. Color coded heat map visualizing the statistical significance of differences between the three studied genotypes × three phenotypes for parameters of muscle composition. The color scale used to rate the level of significance is indicated to the top right.
