
Figure 2.
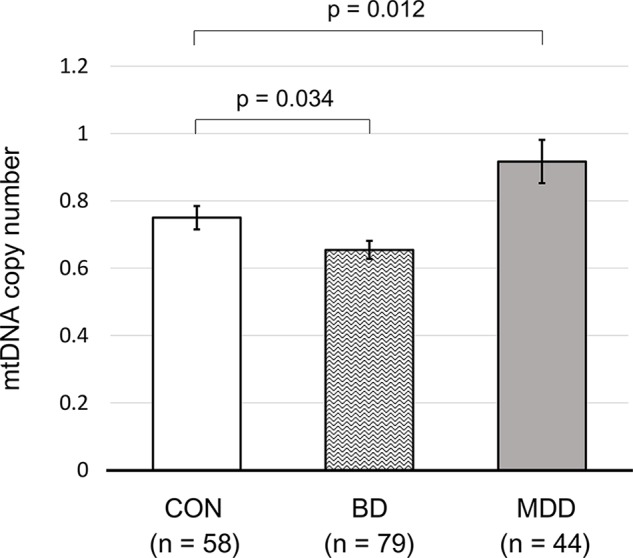
The mtDNA copy numbers of control subjects and patients with bipolar or major depressive disorder. All P values were calculated using generalized linear models, considering patient age and sex. Error bars represent the standard error of the mean. CON, control; BD, bipolar disorder; MDD, major depressive disorder.