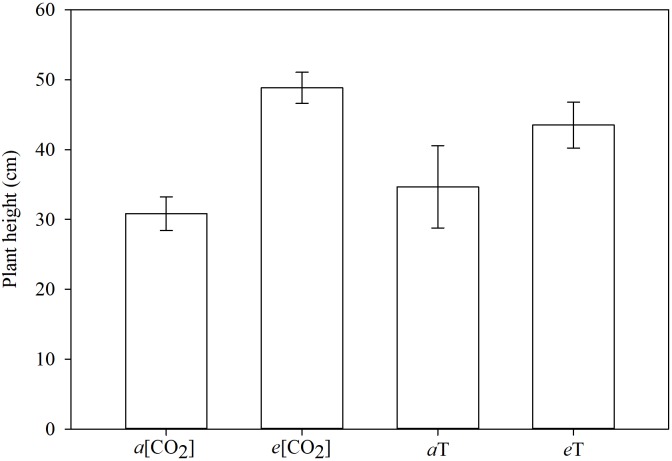
FIGURE 7.
Plant height, 21 days after planting, grouped by environmental conditions. Means followed by the same letter do not differ statistically based on Tukey’s test (P < 0.05). a[CO2] = 400 ± 50 μmol⋅mol-1; e[CO2] = 700 ± 50 μmol⋅mol-1; aT = 23/35°C (night/day); eT = 26/38°C (night/day). F-test (P < 0.05); Fayetteville, AR, United States.

