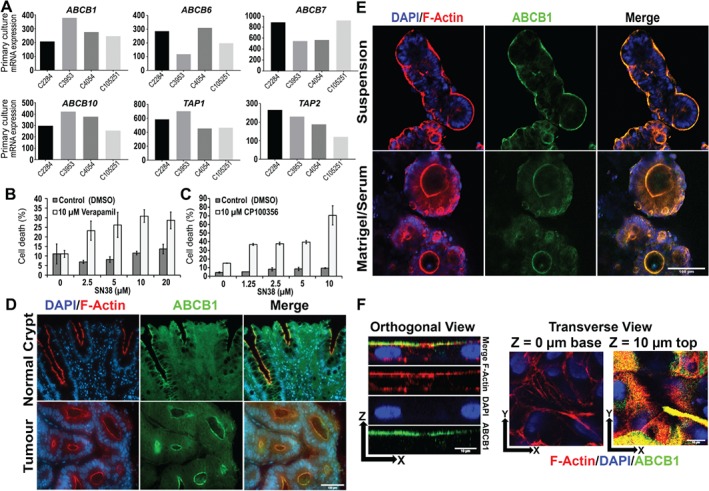
Figure 2.

ABCB1 is polarised to apical‐out and apical‐in orientations in suspension or ECM conditions, respectively, and is involved in resistance to cytotoxic drugs. (A) mRNA levels of ABC family transporters in four primary cultures, determined by microarray analysis. (B) Cell death in serum‐free suspension colonies (C105251) exposed to various concentrations of SN38 in the presence or absence of ABCB1 inhibitor verapamil (10 μm) or vehicle control (DMSO). (C) Same experiment as (B) except using the alternative ABCB1 inhibitor CP100356 (10 μm) compared with vehicle controls (DMSO). The SytoxBlue versus PrestoBlue fluorescence was normalised to detergent‐treated controls (see Materials and methods). *p ≤ 0.05 verapamil versus control (Student's t‐test). Error bars = standard error of the mean. (D) F‐actin (red)/DAPI (blue) and anti‐ABCB1 (green) labelling of cross‐sections of normal colonic crypt tissue and well‐differentiated colonic tumour. Scale bar = 100 μm. (E) Co‐labelling for F‐actin (red), ABCB1 (green) with DAPI (blue) in C105251 primary cultures grown as either serum‐free suspension spheroids or as Matrigel‐embedded cultures in the presence of serum. Scale bar = 100 μm. (F) Orthogonal and transverse views of co‐labelling for ABCB1 (green) and F‐actin (red) with DAPI (blue) in a C105251 primary culture grown as a monolayer for 2 weeks in the presence of serum on cell culture‐treated plastic. Scale bar = 10 μm.
