
Figure 2.
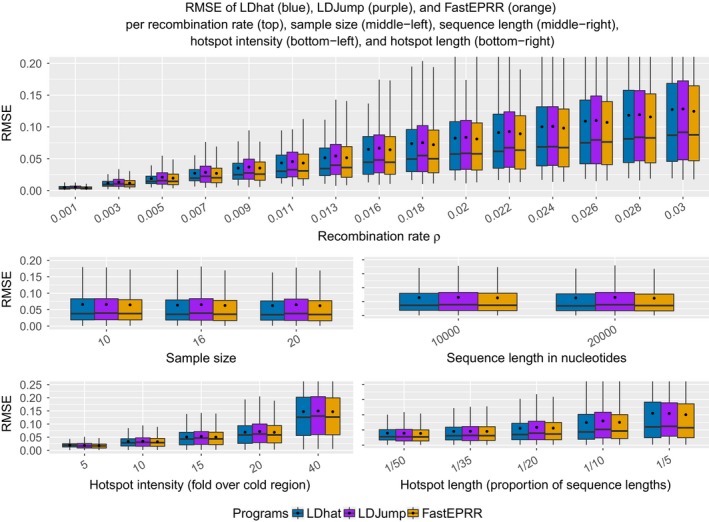
Comparison of the methods (LDhat (blue), LDJump (purple), and FastEPRR (orange) for different true recombination rates (top), sample sizes (middle‐left), sequence lengths (middle‐right), hotspot intensities (bottom‐left), and hotspot lengths (bottom‐right). Mean values are shown as black dots [Colour figure can be viewed at wileyonlinelibrary.com]