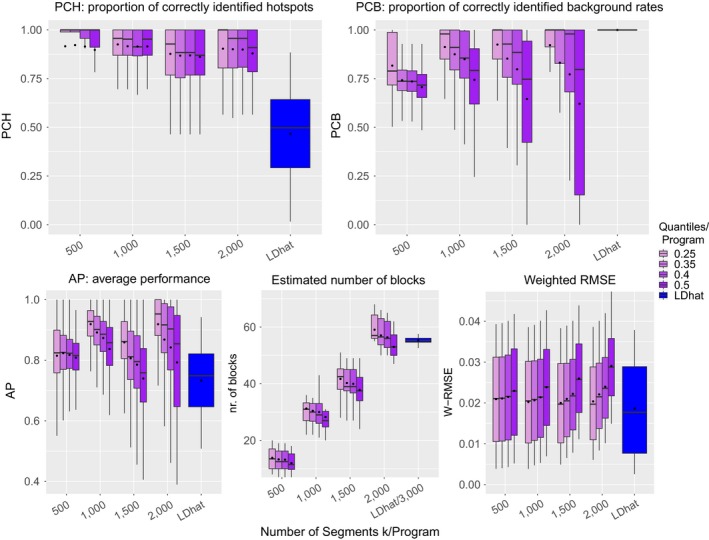
Figure 3.

Natural setups: quality assessment is performed for LDhat and LDJump based on the proportion of correctly identified hotspots (PCH, top‐left), the proportion of correctly identified background rates (PCB, top‐right), the average performance (AP = (PCH+PCB)/2, bottom‐left), the estimated number of blocks (bottom‐middle), and the weighted RMSE (bottom‐right). Based on 13 setups with 20 replicates these measures are computed for LDJump using different numbers of initial segments k (500, 1,000, 1,500, 2,000) and compared with the results from rhomap of LDhat using a block penalty of 50 [Colour figure can be viewed at wileyonlinelibrary.com]
