
Figure 6.
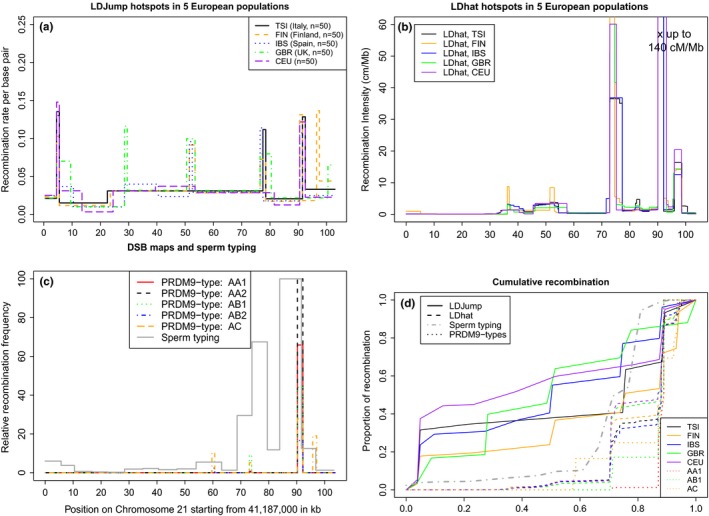
(a) Estimated recombination map of five different European populations (Italy, Finland, Spain, United Kingdom, Northern Europeans from Utah‐CEU) on chromosome 21:41187000–41290679 (GRCH37). (b) The estimated LDhat maps (Auton & McVean, 2007) for the same populations are retrieved from the 1000G (http://www.internationalgenome.org/data-portal/search?q=recombination). (c) Relative recombination based on measured double strand break (DSB) intensities for five different individuals representing active recombination from Pratto et al. (2014). Moreover, we plot in grey (solid line) the estimated crossover frequency of the same 103 kb region on chromosome 21 based on sperm typing 13 intervals ∼5 kb in size, taken from Tiemann‐Boege et al. (2006). The y‐axis was scaled to the maximum of the DSB intensity or crossover frequency within that region, respectively. (d) Accumulation of recombination with increasing sequence for each method and population estimated with LDJump (solid lines), LDhat maps from the 1000G (dashed lines), DSB intensities for three individuals (dotted lines) (Pratto et al., 2014) and sperm‐typing (dash‐dotted line)(Tiemann‐Boege et al., 2006). The colour coding remains the same for the five European populations [Colour figure can be viewed at wileyonlinelibrary.com]