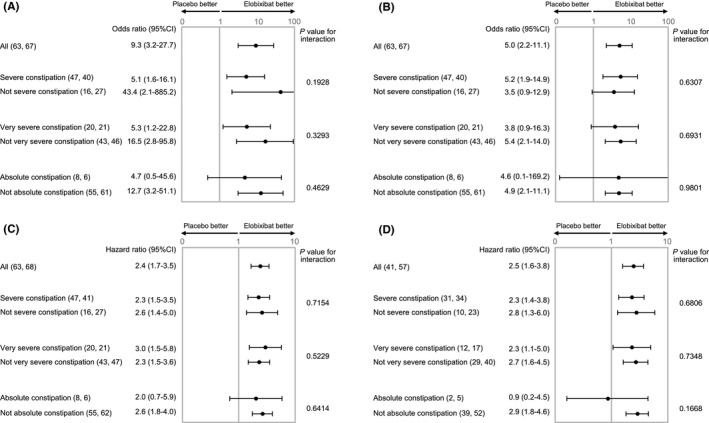
Figure 2.

Subgroup analysis of elobixibat and placebo of weekly SBM (A) or CSBM (B) responder rates at week 1 or time to first SBM (C) or CSBM (D) in more severe chronic constipation in the 2‐wk randomized trial. Data show odds ratios (95% CI: lower limit‐upper limit) for the proportions SBM (A) or CSBM (B) responder rate in elobixibat group vs placebo group or hazard ratio (95% CI) for time to first SBM(C)/CSBM (D) between groups. Number of patients in each subgroup are shown in parentheses (placebo group: elobixibat group). P values for interaction between closest subgroups of patients are shown in the table. Severe constipation: ≤2 SBM and ≤3 BSFS score per week, very severe constipation: ≤1 SBM and ≤3 BSFS score per week, absolute constipation: SBM = 0 per week in second run‐in week. BSFS, Bristol Stool Form Scale; CI, confidence interval; CSBM, complete spontaneous bowel movement; SBM, spontaneous bowel movement
