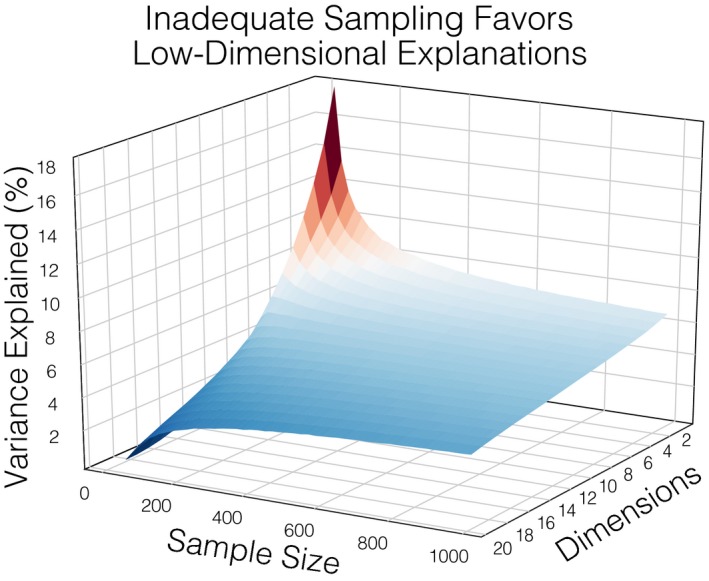
Figure 3.

This simulation illustrates how small sample sizes are biased to favor low‐dimensional explanations even if the true underlying dimensionality of the data is high. We first generate a multivariate gaussian cloud using 10,000 observations comprised of 20 orthogonal dimensions and repeatedly draw random samples of increasing size from this space (100 repetitions per sample size). We then attempt to recover the dimensionality of the simulated data using principal components analysis and plot the distribution of variance explained across the computed components. When small samples are collected from a high–dimensional space, the majority of variance explained comes from the first few (2–3) components, which may lead researchers to mistakenly believe that the population itself is low dimensional. However, when larger data samples are collected, the amount of variance recovered across the dimensions becomes more uniform and in line with the data‐generating process, which would lead to the correct conclusion that the sampled data and therefore the population from which they came are high dimensional.
