Figure 2.

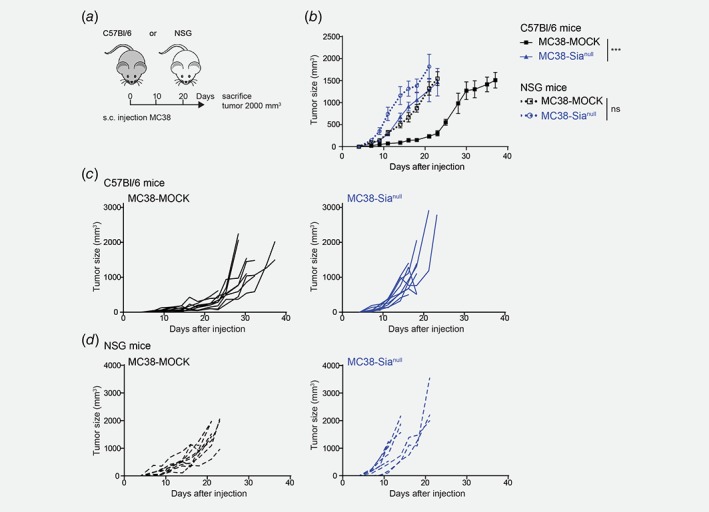
MC38‐Sianull tumors display enhanced tumor growth in vivo. (a) MC38‐MOCK or MC38‐Sianull cells were injected into C57Bl/6 mice (n = 14) and immunodeficient NOD.Cg‐Prkdc scid Il2rg rm1Wjl /SzJ (NSG) mice (n = 9). (b–d) Tumor growth was monitored and depicted as mean tumor size (b) or individual tumor growth curves (c and d). Data are representative of one (d) or three (c) independent experiments. Mean ± SEM; ***, p < 0.001; ns, not significant. [Color figure can be viewed at wileyonlinelibrary.com]
