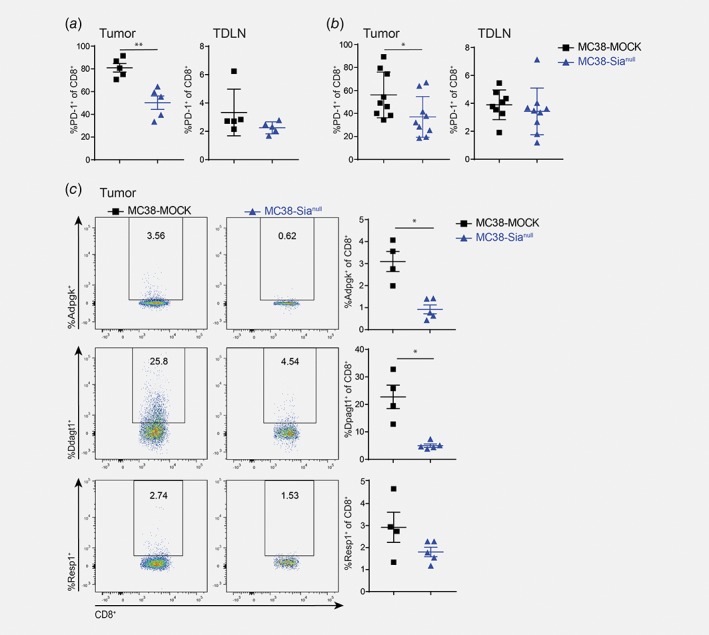
Figure 4.

Less PD‐1 positive and MC38 neoantigen‐specifc CD8+ T cells at the MC38‐Sianull tumor site. (a) and (b) Percentage of PD‐1+CD8+ T cells was analyzed at the tumor location or in tumor‐draining lymph nodes with flow cytometry at an early stage of tumor development (a) or when the tumors reached an equal size (b). (c) Tumor infiltrated CD8+ T cells (viable CD45+CD3+CD8b+) were stained with tetramers specific for three different MC38 neoantigens29 and analyzed by flow cytometry. Data are representative of two independent experiments. Mean ± SEM; *, p < 0.05; **, p < 0.01. [Color figure can be viewed at wileyonlinelibrary.com]
