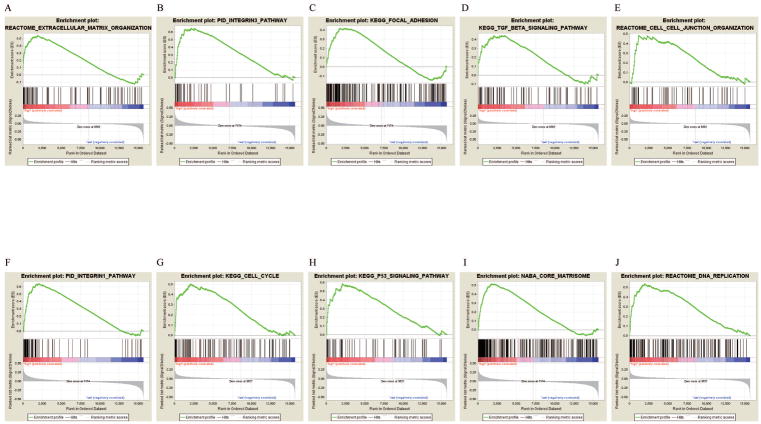
Figure 5. The GSEA analysis results in five datasets.
GSEA validated enhanced activity of (A) “Extracellular matrix organization”, (B) “Integrin3 pathway”, (C) “Focal adhesion”, (D) “TGF-beta signaling pathway”, (E) “Cell-cell junction organization”, (F) “Integrin1 pathway”, (G) “Cell cycle”, (H) “P53 signaling pathway”, (I) “Core matrisome” and (J) “DNA replication” in high risk score group.

