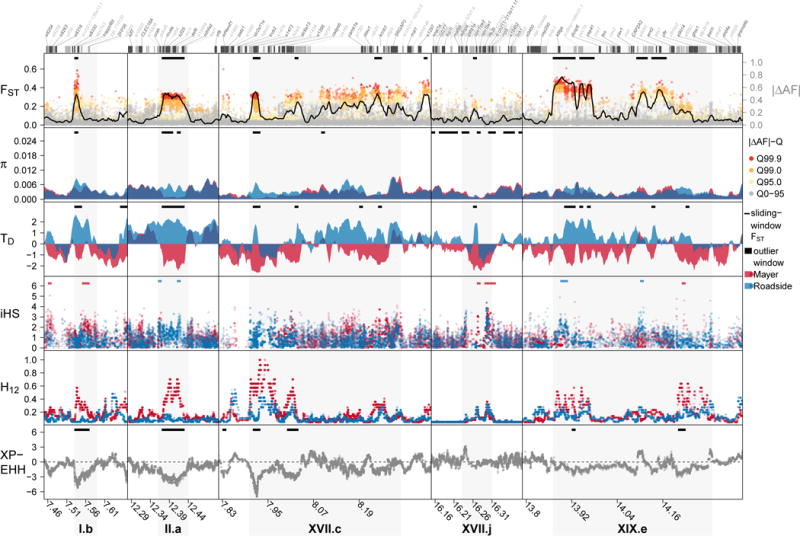
Fig. 4. Local signatures of divergent selection in the genome.

For five of the 77 outlier regions in the genome (grey shading), patterns of differentiation (FST), allele frequency change (|ΔAF|), nucleotide diversity (π), Tajima’s D (TD) and iHS, H12 and XPEHH are shown. Outlier region I.b is centred on a two genes, trappc6bl and bloc1s3, controlling pigmentation in the retina, II.a contains the pigmentation gene mc1r, XVII.j the blue-sensitive colour vision gene opnsw2, likely targets of divergent selection on pigmentation and visual perception. See Supplementary Figs. 5-19 for further outlier regions. The top panel colour code indicates quantiles in the |ΔAF| distribution, black horizontal bars show significant non-overlapping 10kb outlier windows against neutral expectations, gene exons are shown on top (gene names ‘ENSG0000000012345’ shortened to ‘e12345’). Genomic coordinates refer to an improved version of the reference genome80. Lines are sliding-window estimates for 10kb sliding windows with 2.5kb step size, dots are single SNP estimates (|ΔAF|, iHS, XPEHH) or 81-SNP windows (H12).
