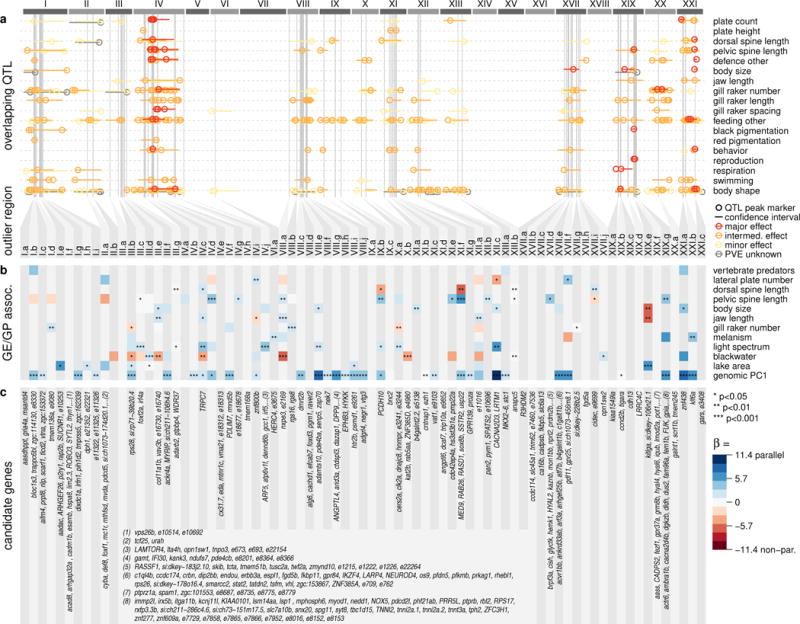
Fig. 5. Outlier regions and overlapping QTL, candidate genes and genome-phenotype/ecology associations across the adaptive radiation.

a Distribution of overlapping quantitative trait loci (QTL). Circles indicate QTL peak markers, horizontal bars confidence intervals and colour codes the effect sizes: major (percentage variance explained, PVE > 25%), intermediate (25% > PVE > 5%) and minor effect QTL (PVE < 5%). b Genome vs. environment and phenotype associations (GE/GP assoc.) and directionality of phenotypic and genomic change between selection experiment and Haida Gwaii adaptive radiation. Predictors retained in generalized linear model for each outlier region are shown in coloured squares, with blue boxes representing parallel genomic and phenotypic/ecological change and red boxes non-parallel change (except for genomic PC1, for which directionality cannot be inferred). The colour code shows the relative effect sizes (β). c List of candidate genes centred on divergent selection patterns in outlier regions.
