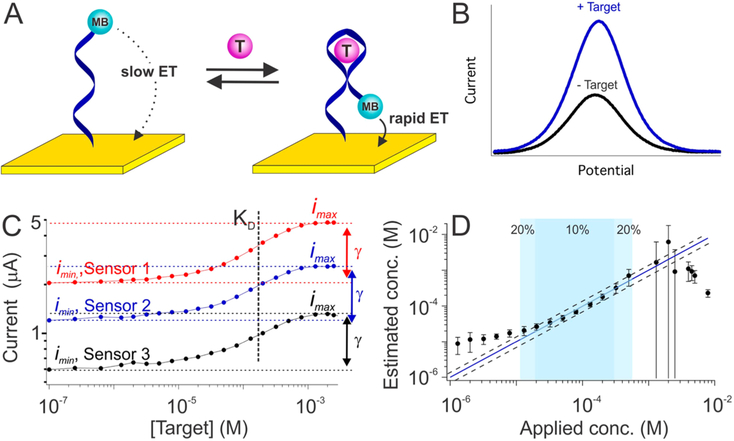
Figure 1.
Electrochemical aptamer-based (E-AB) biosensors. (A) E-AB sensors are comprised of an electrode-bound, redox reporter-modified aptamer that undergoes a binding-induced conformational change. (B) This conformational change upon target binding alters the kinetics with which the reporter (here methylene blue, MB) exchanges electrons with the electrode, producing a target-dependent change in current when the sensor is interrogated via electrochemical methods, such as square wave voltammetry, that are sensitive to changes in electron transfer kinetics. (C) Because of variations in electrode surface area and aptamer packing density, the absolute currents output by E-AB sensors vary dramatically from sensor to sensor. Shown, for example, are titrations of three independently hand-fabricated cocaine-detecting sensors interrogated in undiluted blood serum. Though both the maximum and minimum observed currents observed (imax and imin) vary significantly from sensor to sensor, however, their ratio (denoted as γ) remains constant, as does aptamer affinity, KD. (D) To correct for such sensor-to-sensor variation we have historically used calibration (to determine imin) in a target-free reference sample, which works because the relative output of E-AB sensors (i/imin) is quite reproducible (Figure S1). Using such calibration (and prior knowledge of the constants γ and KD), E-AB sensors achieve excellent accuracy and precision over a broad range of target concentrations. The three cocaine-detecting sensors from panel C, for example, produce concentration estimates (eq 3) within ±10% of the actual (spiked) concentration over the range from 20 to 300 μM (dark blue) and within ±20% over the range from 10 to 600 μM (light blue). The dashed lines represent ±20% accuracy bands. The binding-versus relative occupancy curve becomes quite flat at very high or very low target concentrations (panel C), thus accounting for the poor accuracy and precision seen at target concentrations below 10 μM and above 1 mM. The error bars shown in panel D and in the following figures represent the standard deviation of at least three independently hand-fabricated sensors. Additional data for individual sensors (illustrating, for example, the good precision of calibrated sensors) is presented in Figure S2.

