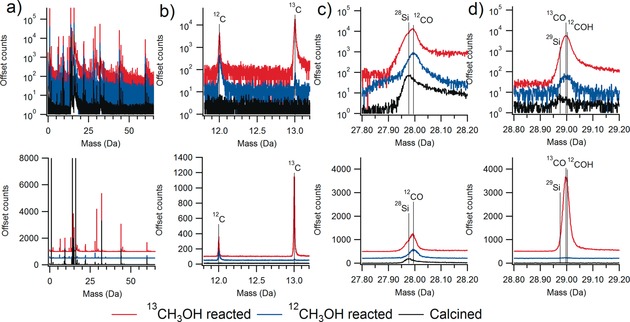
Figure 3.

Example mass spectra for calcined zeolite ZSM‐5 and ZSM‐5 after the methanol‐to‐hydrocarbons (MTH) reaction using both normal methanol (12CH3OH) and 13C isotopically labelled methanol (13CH3OH), with the top traces in log sale and the bottom in linear scale for counts. a) Full relevant mass scale showing the abundance of peaks observed. b) Region showing the presence of 12C and 13C in both reacted samples, with an abundance of 13C from the labelled reaction. c) The peak near 28 Da contains contributions from 28Si and then after the MTH reaction a clear shift due to 12CO is observed. d) The peak near 29 Da is from 29Si and then after reaction predominately 13CO as well as a contribution from 12COH. Note the CO peak was determined to contain 80 % of all carbon making its quantification vital. Samples are from Refs. 64, 70.
